Tympanometry
Relevant Paper
ASHA Working Group on Aural Acoustic-Immittance Measurements, Committee on Audiologic Evaluation
About this Document
This document was prepared by the American Speech-Language-Hearing Association (ASHA) Working Group on Aural Acoustic-Immittance Measurements of the Committee on Audiologic Evaluation. The Working Group members were Janet E. Shanks (chair), David J. Lilly, Robert H. Margolis, Terry L. Wiley, and Richard H. Wilson. The Committee on Audiologic Evaluation members were Sandra Gordon-Salant (chair), Carmen Brewer, Margaret F. Carlin, Thomas A. Frank, Michael P. Gorga, Gregg D. Givens, Carol Kamara (former ex officio), and Evelyn Cherow (current ex officio). The monitoring vice president was Gilbert R. Herer, ASHA president-elect and former vice president for clinical affairs. The Executive Board approved the publication of this tutorial at the August 1987 Executive Board meeting (EB 50-87).
Tympanometry has been performed routinely in clinical settings since the early 1970s. The first generation of acoustic-immittance instruments measured only the magnitude of acoustic immittance using a single low-frequency probe tone. The next generation of instruments was capable of making two-component, two-frequency measurements. Despite a significant body of literature demonstrating the advantage of using the more complex measurements for evaluating some types of middle-ear pathologies, many have persisted with the more familiar and simplified measurement techniques of the early 1970s. With the rapid integration of computers into the field, acoustic-immittance measurements are likely to become even more sophisticated, thus increasing the gap between advances in technology and instrumentation and an understanding of acoustic-immittance data. The primary objective of this tutorial is to enhance the understanding of two-component, multiple-frequency acoustic-immittance measurements in preparation for the next generation of computer-interfaced instruments and to demonstrate cases in which these measurements can be especially useful. It is recognized, however, that there are some instances in which only a screening procedure and a superficial analysis of the tympanometric data are necessary. Screening for middle-ear effusion has been the topic of several articles and will not be discussed further in the present paper.
The first step in interpreting tympanometric data is to gain a thorough understanding of the basic principles underlying all acoustic-immittance measurements. Because several comprehensive chapters and articles already are available on basic principles, this topic will not be discussed in depth ( Lilly, 1973; Lilly & Shanks, 1981; Margolis, 1981; Margolis & Shanks, 1985; Popelka, 1984; Shanks, 1984; Van Camp & Creten, 1976; Van Camp, Margolis, Wilson, Creten, & Shanks, 1986; Wiley & Block, 1979; Wiley & Block, 1985).
The subsequent sections of this tutorial will focus primarily on areas for future development and on areas not reviewed extensively in the past literature. The first major section on the standardization of acoustic-immittance instruments presents terminology and instrument characteristics defined in the recently adopted American National Standard (ANSI, S3.39, 1987) Specifications for Instruments to Measure Aural Acoustic Impedance and Admittance (Aural Acoustic Immittance). An immediate benefit of the standard will be the promotion of consistent and accurate terminology. Sections on instrument characteristics and calibration procedures also will help to promote accurate and clearly specified acoustic-immittance measurements.
The next section provides a discussion of normal tympanometric shapes and amplitudes for a variety of probe frequencies and plotting strategies. A thorough understanding of normal characteristics is essential before tympanometric measurements can be applied effectively to pathological populations. The last section applies the preceding normal principles to pathological data. Several examples of abnormal tympanometric patterns plotted in a variety of formats are presented.
Although tympanometry is a powerful addition to the audiologic test battery, the measures must be interpreted with the following two limitations in mind. First, caution must be exercised in correlating tympanometric findings with hearing sensitivity. Tympanometry is a measurement of the input impedance or admittance of the middle-ear transmission system. The acoustic energy that flows into the system can be measured but not how much energy is transmitted through the system. For example, an eardrum pathology such as tympanosclerotic plaques or neomembrane typically is associated with an abnormally flaccid tympanometric pattern, but hearing sensitivity remains relatively unaffected. Conversely, otosclerosis produces a marked hearing loss in conjunction with a relatively normal tympanometric pattern.
Secondly, tympanometry is only one of several tests that contribute information concerning the status of the middle-ear transmission system. A case history, an otoscopic examination, air- and bone-conduction thresholds, and acoustic-reflex measurements all contribute useful information. No matter how complex tympanometric measures become, they will never be able to attribute an abnormal finding to a specific middle-ear structure or to one and only one etiology. The same tympanometric pattern can be recorded from ears with different pathologies. For example, similar flat tympanograms can be recorded from ears with middle-ear effusion, malleus fixation, and tympanic membrane perforation with cholesteatoma. Similarly, a given middle-ear pathology will not always produce identical tympanometric patterns. For example, middle-ear effusion often is associated with a flat tympanogram, but depending on the amount of fluid, middle-ear effusion also may produce a broadly notched tympanogram. Recent advances in tympanometric measurements may reduce some of the overlap, but the expectation of a perfect correlation between a specific pathology and tympanometric pattern is unrealistic.
Standardization of Acoustic-Immittance Instruments
Terminology
One of the first and most obvious problems in discussing tympanometric data is the lack of standardization of acoustic-immittance instruments. As a consequence, the terminology associated with tympanometry has been inconsistent and, at times, confusing. The recently adopted American National Standard for acoustic-immittance instruments (ANSI S3.39, 1987) should help to rectify this long-standing problem. The International Electrotechnical Commission (IEC SC29C) also is nearing completion of an international standard for aural-impedance/admittance instruments. The two groups coordinated their efforts to ensure that the terminology and instrument specifications would be nearly identical in the two standards. To avoid further confusion, the terminology recommended in the ANSI standard will be used throughout this tutorial. The following list of terms pertains specifically to tympanometric measurements and instrumentation.
-
Acoustic immittance refers collectively to acoustic impedance, to acoustic admittance, or to both quantities.
-
Acoustic impedance (Za in acoustic ohms) is the complex ratio of effective sound pressure averaged over a surface to the effective volume velocity through it.
-
Acoustic admittance (Ya in acoustic mmhos) is the complex ratio of the effective volume velocity through a surface to the effective sound pressure averaged over the surface. Acoustic admittance is the reciprocal of acoustic impedance.
-
In polar notation, acoustic immittance is expressed as a magnitude and a phase angle.
-
Acoustic-impedance magnitude (|Za|) in acoustic ohms) and acoustic-admittance magnitude (|Ya|) in acoustic mmhos) refer to the length of the total impedance or admittance vector.
-
Phase angle (f in degrees or radians) refers to the angle between the total immittance vector and the positive real axis. (Admittance phase angle [fy]) refers to the angle between the admittance vector and the real [x] axis; impedance phase angle [fz]) refers to the angle between the impedance vector and the real [x] axis. Admittance and impedance phase angles are related as follows: fy = -fz.)
-
In rectangular notation, acoustic immittance is expressed as a complex number.
-
Acoustic resistance (Ra in acoustic ohms) is the real component of complex acoustic impedance.
-
Acoustic reactance (Xa in acoustic ohms) is the imaginary component of complex acoustic impedance and is the algebraic sum of mass reactance (Xm) and compliant reactance (-Xc).
-
Acoustic conductance (Ga in acoustic mmhos) is the real component of complex acoustic admittance.
-
Acoustic susceptance (Ba in acoustic mmhos) is the imaginary component of complex acoustic admittance and is the algebraic sum of mass susceptance (-Bm) and compliant susceptance (Bc).
-
Acoustic equivalent volume (Vea in cm3) refers to acoustic-immittance measurements specified in terms of an enclosed volume of air.
-
The probe is a coupling device used to connect the acoustic-immittance instrument to the external auditory meatus.
-
The probe tip is a device that is used to seal the probe into the external auditory meatus.
-
The probe signal is the acoustic signal that is emitted through the probe into the external auditory meatus and is used to measure acoustic immittance.
-
Air pressure (in dekapascals, daPa) refers to the air pressure in the external auditory meatus or in calibration cavities relative to atmospheric pressure at the location of measurement (1 daPa = 1.02 mm H20 or 1 mm H20 = 0.98 daPa at 20° C).
-
Static acoustic immittance is measured in the external auditory meatus at a constant, specified air pressure, and in the absence of a middle-ear muscle reflex-activating signal.
-
Compensated static acoustic immittance is a static acoustic immittance that has been compensated for the acoustic immittance of the external auditory meatus. This value represents an estimate of the acoustic immittance at the lateral surface of the tympanic membrane and is indicated by replacing the subscript a with the subscript tm.
-
Ambient compensated static acoustic immittance is the static acoustic immittance obtained with ambient air pressure in the external auditory meatus.
-
Peak compensated static acoustic immittance is the static acoustic immittance obtained with air pressure in the external auditory meatus adjusted to produce an extremum (i.e., the maximum value for a single peaked tympanogram or the central minimum for a notched tympanogram) in the measured acoustic immittance. This value usually is obtained from a centrally located extremum in the tympanogram.
-
Dynamic acoustic immittance is measured during tympanometry with a continuous change in air pressure or during activation of any middle-ear muscle reflex.
-
Tympanometry is the measurement of acoustic immittance in the external auditory meatus as a function of air pressure within the external auditory meatus.
-
Measurement-plane tympanometry is a measurement of acoustic immittance in the measurement plane and comprises the combined acoustic immittance of the external auditory meatus and the middle ear.
-
Compensated tympanometry is a measurement of acoustic immittance that has been compensated for the acoustic immittance of the external auditory meatus.
-
Tympanometric peak pressure is the ear-canal pressure (in daPa) producing the centrally located extremum in the measured acoustic immittance (not defined in the ANSI or IEC standards).
Instrumentation
The instruments used to make aural acoustic-immittance measurements[1] can be classified according to (a) the minimal functions that are performed, as in the American and proposed international standards for immittance devices, and (b) the type of measurement that is obtained with the instrument (i.e., impedance, admittance, etc.). (For a detailed discussion, see Van Camp et al., 1986.) Regardless of the classification system, immittance instruments have the following five basic components.
-
A probe, which is sealed in the external auditory meatus, contains (a) a driver (loudspeaker) that produces the probe signal, (b) a microphone that monitors the sound pressure developed within the enclosed ear canal, and (c) a port for the pneumatic system.
-
A pneumatic system is used to vary the air pressure in the ear canal between the probe tip and the tympanic membrane; usually the air pressure (in daPa) can be monitored on a meter.
-
An acoustic-immittance measurement system, which is described in detail later, converts the relation between the driver and microphone voltages in the probe device into immittance units.
-
An acoustic-reflex activator system delivers pure tones, noise signals, or both to the contralateral ear, to the ipsilateral ear, or to both ears.
-
A recording device (meter, X-Y plotter, oscilloscope, computer, etc.) plots the physical immittance units of measurement as a function of air pressure (tympanometry) or as a function of time (acoustic reflex).
One classification of immittance instruments is based on the functions that the instrument performs. When purchasing an instrument, the intended application of the device should be kept in mind. The most complex instrument is not always the best choice. The following four types of instruments are defined in the American and proposed international standards for impedance and admittance instruments.
-
Type 1: This instrument shall have the capability for measurement-plane and compensated static immittance and tympanometry under manual and automatic control of air pressure, and for the measurement of ipsilateral and contralateral acoustic reflexes. A Type 1 instrument shall be capable of generating noise and pure-tone acoustic reflex-activating signals.
-
Type 2: This instrument shall have the capability for compensated static immittance and tympanometry under manual or automatic control of air pressure, and for the measurement of ipsilateral or contralateral acoustic reflexes. A Type 2 instrument shall be capable of generating pure-tone acoustic reflex-activating signals.
-
Type 3: This instrument shall have the capability for static immittance, tympanometry, and for monitoring an acoustic reflex at a specified activating-signal intensity level.
-
Type 4: This category of special-purpose immittance instruments may have the capability for static immittance measurements alone, for tympanometry alone, for acoustic-reflex measurements alone, or for any combination of these or other acoustic measurements within the external auditory meatus.
The second classification system used to categorize immittance instruments is based on the type of measurement that is obtained with the instrument. The following five types of instruments are included in this system: (a) impedance meters, (b) admittance meters, (c) admittance and phase meters, (d) conductance and susceptance meters, and (e) instruments with nonsinusoidal probe signals.
In the case of an impedance meter (e.g., Madsen, Model ZO73), a constant volume-velocity source (driver) produces a microphone voltage that is directly proportional to the impedance at the probe tip. Typically, the microphone signal is rectified and filtered to convert it from an ac voltage to a proportional dc voltage that is directed to a meter on which the magnitude is displayed. The sound pressure at the probe, however, depends on the impedance of the middle ear and ear canal; the probe sound-pressure level at which tympanometric measures are made would differ for each ear if a compensation were not made. To maintain a constant sound-pressure level of the probe signal across ears, a balance meter is used in the circuit. The balance meter compares the rectified microphone signal with an internal reference voltage and produces a voltage (representative of the difference) that is displayed on a meter and/or delivered to a recording device. When the microphone voltage and the reference voltage are equal, the balance meter produces a voltage that corresponds to a meter reading of zero. Because the measuring device usually is not rebalanced during tympanometry and because the output of the balance meter is nonlinearly related to the impedance at the probe tip, a tympanogram is plotted in arbitrary units, which sometimes are referred to as compliance units.
Because admittance is the reciprocal of impedance, admittance is directly proportional to a constant peak volume velocity (Uo) and is inversely proportional to peak sound pressure (po). On admittance meters (e.g., Madsen, Model ZO76, and Grason-Stadler, Model 27A), the peak volume velocity (Uo), which is directly proportional to the rectified driver voltage, is displayed on a meter or other recording device as a measure of the admittance magnitude at the probe tip. The peak sound pressure (po) in admittance meters is maintained at a constant level by an automatic gain control (AGC) circuit that controls the voltage delivered to the driver. The AGC circuit is a feedback loop between the microphone in the probe and the amplifier that provides the signal to the driver. The driver voltage is adjusted continuously by the AGC in response to the changing microphone voltage so that a constant sound-pressure level is maintained in the ear canal.
With the application of computer technology, admittance-phase angle meters (e.g., Virtual, Model 310) have become available. An admittance-phase angle meter is simply an admittance meter with a phase meter added to the circuit. By measuring the phase difference between two sinusoidal signals (microphone voltage and a reference voltage), the phase meter is used to estimate the admittance phase angle at the probe tip.
The conductance-susceptance meter (e.g., Grason-Stadler, Models 1720 and 1723) is identical to the admittance meter except that the admittance at the probe tip is recorded in rectangular form. Instead of analyzing the magnitude of the microphone voltage and the driver voltage as in the admittance meter, the two signals in the conductance-susceptance meter are evaluated to produce an in-phase (0°) component and an out-of-phase (90° or quadrature) component. Because the microphone and driver voltages are of the same frequency with different amplitudes and phases, the real and imaginary components can be separated by special electronic circuits (multipliers). The conductance (in-phase or real) component and the susceptance (out-of-phase or imaginary) component of admittance then are displayed on the recording device.
An instrument with a nonsinusoidal probe signal recently has become available (Acoustimed, Model ZA-2000). This instrument utilizes a broad-band click as opposed to discrete-frequency probe tones; a Fourier analysis then is used to obtain measures at discrete frequencies from 200 to 4000 Hz. The primary advantage of this instrument is that only one pressure sweep is necessary for multiple-frequency tympanometry; this procedure, therefore, is not as time consuming as other procedures that require a pressure sweep at each probe frequency.
Calibration
Basic calibration procedures must be performed on every immittance instrument to ensure valid and reliable immittance measures. Both the ANSI (S3.39, 1987) and the proposed IEC standards on the specification and calibration of immittance instruments apply only to 226-Hz probe signals, although some current instruments and many future instruments will employ multiple-probe frequencies. Most of the subsequent discussion, however, also can be applied to other probe signals. The basic calibration procedures and tolerance levels necessary for immittance instruments are summarized briefly in this section. In addition, the user should be familiar with the instrument specifications and should perform the calibrations recommended by the manufacturer of the immittance device.
Acoustic-immittance measurement system. Because an enclosed volume of air has a known impedance, cavities can be used to determine the accuracy of the immittance system (see Lilly & Shanks, 1981). The standards require that at least three calibration cavities with volumes of 0.5, 2.0, and 5.0 cm3 be provided with Type 1, 2, and 3 instruments. The range of immittance measurements available on instruments designed for 226 Hz measurement-plane tympanometry must be at least 0.2–5.0 acoustic mmhos (5000-200 acoustic ohms). For compensated tympanometry, instruments must be capable of measuring admittance over a range of at least 0–2 acoustic mmhos (or 10000-500 acoustic ohms) for Type 1 and 2 instruments and over a range of 0–1.2 acoustic mmhos (or 10000-833 acoustic ohms) for Type 3 instruments. The accuracy of the measurements must be within ±5% or ±0.1 acoustic mmhos (±50 acoustic ohms), whichever is greater. Care should be taken to account for the atmospheric conditions (e.g., altitude and barometric pressure) common to the specific location ( Lilly & Shanks, 1981; Shanks, 1987).
Probe signal. The probe signal must be accurate in frequency, at a specified sound-pressure level, and free of unwanted distortion and noise. Measures of these probe-signal characteristics can be performed using a standard HA-1 (2 cm3) coupler and a sound-level meter. The output levels should be checked against the levels specified by the instrument manufacturer but must not exceed 90 dB SPL as specified in the standards. Frequency accuracy and harmonic distortion (and noise) can be evaluated with a digital counter and distortion analyzer, respectively. According to the standards, the frequency of the probe signal must be within ±3% of the nominal frequency, and the total harmonic distortion must not exceed 5%.
Pneumatic system. The pneumatic system should be evaluated to determine the rate of air-pressure change and the accuracy and linearity of the air-pressure indicator (manometer). The accuracy of the pneumatic system can be determined with an external manometer (e.g., U tube) graduated in calibrated steps that are smaller than the unit accuracy of interest. If an external recording device (such as an X-Y plotter) is used, then the correspondence between manometer readings and pressure readings indicated on the recorder chart must be determined. The standards specify that Type 1 and 2 instruments must be capable of making pressure changes between +200 and -600 daPa, and Type 3 instruments between +100 and -300 daPa. In addition, the air-pressure accuracy must be within ± 10 daPa for all instruments or ± 10% for Type 1 and 2 instruments and ± 15% for Type 3 instruments, whichever value is greater. No instrument should produce pressures less than -800 or more than 600 daPa as measured in a 0.5-cm3 calibration cavity. This extreme pressure range probably is not advisable for patients with monomeric tympanic membranes or recent tympanoplasties. A range of -600 to 400 daPa should be extreme enough to evaluate all patients. Because the immittance of the ear is affected by the rate of air-pressure change, the rate must be specified for each instrument.
Tympanogram format. If an external recording device is used, then the meter calibration must be consistent with the chart recording. That is, the value indicated on the immittance meter must correspond to the appropriate value on the chart paper for all calibration cavities. The standards also recommend uniform methods to scale and label both axes of a standard tympanogram. The label on the vertical axis of the tympanogram should read, “Acoustic Admittance (10-8 m3/Pa's [Acoustic mmho])” or “Acoustic Admittance of an Equivalent Volume of Air (cm3).” The horizontal axis should read, “Air Pressure (daPa) (1 daPa = 1.02 mm H20).” Both axes should be scaled linearly and should have an aspect ratio of 300 daPa to 1 acoustic mmho or 1 cm3. Other scaling options also can be provided to improve resolution.
Analysis of Tympanometric Shape and Amplitude
In the analysis of physical systems, it is common to evaluate transmission characteristics across the range of frequencies over which the system is designed to operate. In auditory assessment, for example, hearing sensitivity typically is evaluated over a range of five octaves. The acoustic immittance of the middle ear, however, generally is evaluated at only one or two frequencies. The evaluation of immittance characteristics of the middle ear at one or two probe frequencies is a narrow view of the characteristics of the system, oftentimes inadequate to understand the effect of a pathology on the transmission properties of the middle ear. Preliminary data support the use of multifrequency tympanometry for clinical measurements.
Investigators who have studied the clinical value of tympanometry over a wide frequency range are nearly unanimous in finding that multifrequency tympanometry provides valuable clinical information not obtained from measures at a single probe frequency ( Colletti, 1975; Margolis, Van Camp, Wilson, & Creten, 1985). As a consequence of these reports, the newest immittance systems (e.g., Virtual, Model 310; Grason-Stadler, Model 33; Acoustimed, ZA-2000; Nicolet, Aurora) will incorporate multiple probe-tone frequencies (200–2000 Hz). At present, however, most clinical experience has been obtained with a single low-frequency (220 or 226 Hz) probe and in some cases, with an additional higher probe frequency (660 or 678 Hz). These particular frequencies were selected, in part, for the ease of conversion from a volume of air to acoustic immittance. Under standard atmospheric conditions, and with some constraints on the geometry of the enclosure, the admittance of 1.0 cm3 of air is 1.0 acoustic mmho at 226 Hz and the impedance is 1000 acoustic ohms. This relation simplifies the calibration of immittance instruments, which are calibrated with known volumes of air. (See Lilly and Shanks [1981] for a discussion of the immittance of an enclosed volume of air.)
Two approaches to the interpretation of tympanograms are in widespread use: (a) classification of tympanometric shape and (b) calculation of compensated static immittance. Calculation of static immittance can be of clinical value, particularly for low-frequency probe tones at which most tympanograms are single peaked, but an analysis of the morphology of the tympanograms may be more informative for high probe frequencies at which many of the tympanograms are notched in both normal and pathological ears. Several methods have been suggested for analyzing tympanometric shapes to aid in differentiating between normal and pathological middle ears. The typing of tympanometric patterns, popularized by Liden ( 1969); Liden, Peterson, and Bjorkman ( 1970); and Jerger ( 1970), probably is in the most widespread use. Feldman ( 1976a, 1976b, 1977) and Paradise, Smith, and Bluestone ( 1976) expanded these types to include a descriptive analysis of amplitude, peak pressure, and tympanometric width (gradient). With the exception of Feldman ( 1976a, 1976b, 1977), most classification procedures have been applied to single-component (admittance magnitude), single-frequency (226 Hz) tympanograms ( Margolis & Shanks, 1985, Figures 23.1, 23.2, & 23.4). For the most efficient clinical interpretation, however, low-frequency tympanograms may be best suited for static-immittance measurements. A descriptive analysis of tympanometric shape at 226 Hz is not particularly useful because normal low-frequency tympanograms are single peaked, except for some neonate ears. In general, pathological conditions of the middle ear do not alter the basic tympanometric shape for a low-frequency probe signal unless the impedance is so high as to obliterate the peak. Most abnormal 226-Hz tympanograms remain single peaked but have an abnormal peak amplitude. The best way to distinguish between normal and abnormal single-peaked tympanograms is by quantifying the peak amplitude (i.e., by calculating compensated static immittance).
Morphological Analysis
The original classification systems reviewed by Margolis and Shanks ( 1985) have been discussed repeatedly in the literature and will not be discussed here. In many settings, such as schools and pediatric practices, a tympanometric screening procedure and superficial analysis provide adequate information. The subsequent discussion, however, will focus on more complex and innovative analyses of tympanograms that are becoming increasingly popular owing to a new generation of microprocessor-based immittance devices. Immittance data can be generated in a short period of time and, through the use of computer software, can be plotted and analyzed using a variety of formats. The new generation of immittance devices are capable of two-component, multiple-frequency measurements with the option of plotting the tympanograms in any or all of the following forms: (a) admittance and phase angle, (b) susceptance and conductance, (c) impedance and phase angle, (d) reactance and resistance, (e) phasor diagram (conductance by susceptance as a function of pressure), and (f) three-dimensional (frequency by immittance magnitude by pressure). The next few sections will present data plotted in susceptance, conductance, and admittance units because most of the currently available tympanometric data appear in those formats. A subsequent section on abnormal tympanograms will present individual data plotted in a variety of formats that will be optional on some of the newer instruments.
The first step in analyzing complex tympanograms is to understand how normal tympanometric shapes vary as a function of the immittance component measured and the probe frequency used. The next step is to examine changes in tympanometric shape with various middle-ear pathologies to determine which tympanometric characteristics are useful in the differential diagnosis of middle-ear disease. The immittance of the ear is frequency dependent. As a consequence, tympanometric shape also is frequency dependent. At low probe frequencies, normal adult tympanograms are single peaked regardless of which immittance component is measured. As probe frequency increases, susceptance tympanograms first become double peaked, followed by conductance and admittance tympanograms. Newborns, however, demonstrate a variety of tympanometric shapes at various probe frequencies and often evidence notched patterns, particularly at low frequencies ( Himelfarb, Popelka, & Shanon, 1979; Sprague, Wiley, & Goldstein, 1985).
Figure 1, taken from Margolis et al. ( 1985), demonstrates changes in susceptance, conductance, and admittance tympanograms for probe frequencies of 220–910 Hz. At 220 Hz, the amplitude of the susceptance tympanogram is approximately twice as great as the conductance tympanogram; the admittance tympanogram is similar in shape to the larger, susceptance component. Plotting the peak compensated values on a vector diagram is helpful in understanding changes in middle-ear characteristics as a function of probe frequency. The vector diagrams in Figure 2 show the normal peak compensated static admittance values in both polar (admittance magnitude and phase angle) and rectangular (susceptance and conductance) forms. The first panel shows the 2:1 peak amplitude relation of susceptance to conductance at 220 Hz, which results in an admittance phase angle of 63°. Although the magnitudes of susceptance, conductance, and admittance may vary among individuals, clinical experience has shown that the relation between the two rectangular components and, therefore, the phase angle remains more constant among subjects. Phase angle is the only immittance component that is calculated from the ratio of the two rectangular components (see Equations 1–10 in a subsequent section). For this reason, future research with the new generation of immittance devices may show phase angle to be a valuable immittance component.
Figure 1. Multiple frequency (220–910 Hz) susceptance (B), conductance (G), and admittance (Y) tympanograms recorded for descending (+/-) ear-canal pressure changes (from Margolis et al., 1985).
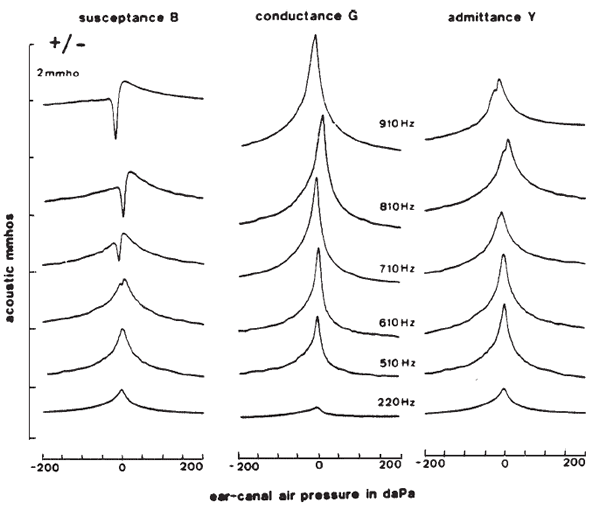
Figure 2. Vector diagrams showing normal peak compensated static admittance at 220, 610, 710, and 810 Hz plotted both in polar (admittance [Y] and phase-angle [f]) and rectangular (susceptance [B] and conductance [G]) forms.
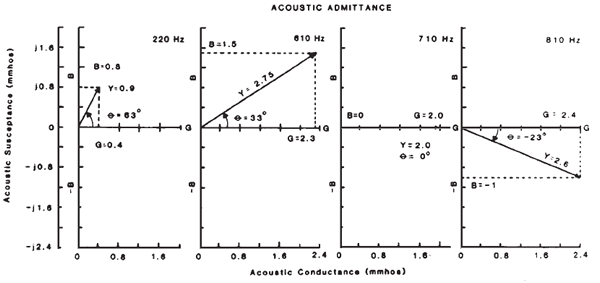
In comparison with 220 Hz, the 610 Hz susceptance tympanogram in Figure 1 has increased in magnitude, has developed a slight notch, and has a conductance component that is larger than the susceptance component. The admittance tympanogram again is similar in shape to the larger component, which now is conductance. The second panel of Figure 2 shows the 610 Hz peak compensated components plotted on the vector diagram. The admittance vector is closer to the X-axis than to the Y-axis; this magnitude relation between susceptance and conductance results in a phase angle of 33°. Clinical experience with a normal, adult male population shows similar results at 678 Hz. At 678 Hz, the magnitudes of the two rectangular components are approximately equal (phase angle = 45°), or more commonly, the magnitude of conductance is larger than the magnitude of susceptance (phase angle < 45°).
As the probe frequency is increased to 710 Hz, the notch in the susceptance tympanogram ( Figure 1) dips to 0 acoustic mmhos, or nearly equal to the tail value, and the magnitude of conductance increases further. The shape of the admittance tympanogram again resembles that of the single-peaked conductance tympanogram. The relation between susceptance and conductance again is demonstrated in the vector plots in Figure 2 (third panel). The admittance vector is lying along the X or conductance axis because susceptance is equal to 0 acoustic mmhos. The middle-ear system is said to be at resonance; phase angle is 0°. Throughout this paper, resonant frequency refers to the lowest resonant frequency of the middle-ear transmission system. The middle ear, however, is broadly tuned and may remain near resonance (i.e., susceptance remains near 0 acoustic mmhos) over a broad frequency range.
As the probe frequency is increased (810 and 910 Hz) above the resonant frequency, the notch in the susceptance tympanogram in Figure I deepens and becomes negative. In this example, the conductance tympanograms increase in magnitude and remain single peaked, and the admittance tympanograms begin to notch. On the vector diagram in Figure 2, the admittance vector at 810 Hz now lies in the lower quadrant owing to the negative susceptance value and a negative phase angle. Although the susceptance tympanogram will notch below the middle-ear resonant frequency, the conductance and admittance tympanograms will not notch until the probe frequency exceeds the middle-ear resonant frequency (see Figure 1). Examination of the admittance tympanograms in Figure 1 suggests that the admittance tympanograms are not as sensitive to changes in probe frequency as are susceptance tympanograms. The shape and magnitude of the admittance tympanograms remain relatively constant over a wide range of probe frequencies. Susceptance is the main contributor to admittance magnitude in the low frequencies, whereas conductance is the main contributor to admittance magnitude in the high frequencies. It is sometimes difficult, therefore, to reach conclusions regarding changes in middle-ear resonance when only the admittance magnitude is recorded at 678 or 800 Hz.
Commercially available electroacoustic immittance devices provide measures of the algebraic sum of stiffness and mass susceptance, which are 180° out of phase. If the stiffness component is larger than the mass component, then susceptance is positive (i.e., the admittance vector is in the upper quadrant) and the ear is stiffness controlled. The ear is stiffness controlled at 220 and 610 Hz in Figures 1 and 2. At the resonant frequency of the middle-ear transmission system, the stiffness and mass components are equal in magnitude. Because they are 180° out of phase, stiffness and mass susceptance sum to 0 acoustic mmhos and the middle ear is at resonance (710 Hz in Figures 1 and 2). As the probe frequency is increased further, the mass component becomes larger than the stiffness component and the total susceptance becomes negative (810 Hz in Figures 1 and 2); the ear now is mass controlled.
Although most low-frequency (226 Hz) tympanograms are single peaked and bell shaped, higher frequency (678 Hz) tympanograms can have a multitude of shapes ranging from single peaked to various configurations of multipeaked. High-frequency multipeaked or notched tympanograms first were described by Liden ( 1969); Liden et al. ( 1970); and Liden, Harford, and Hallen ( 1974) and were called W patterns because of the inverted admittance plot. Initially, multipeaked tympanograms were thought to be indicative of middle-ear pathology. Following the mathematical analysis of multipeaked tympanometric patterns by Vanhuyse, Creten, and Van Camp ( 1975), it now is understood that both normal middle ears and pathological middle ears can produce multipeaked tympanograms.
Vanhuyse et al. ( 1975) developed a model, which is illustrated in Figure 3 (taken from Osguthorpe, 1986), to explain the shapes of normal and abnormal susceptance and conductance tympanograms based on the relation between resistance and reactance tympanograms. In all cases, a monotonically decreasing resistance tympanogram as a function of increasing ear-canal pressure is assumed with an inverted V-shaped reactance tympanogram that is successively shifted toward more positive values (or less stiffness-dominated values) without changing its shape. In each of the quadrants of Figure 3, Panel a shows the relationship between resistance (R) and reactance (X), Panel b shows the corresponding susceptance (B) tympanogram, Panel c shows the corresponding conductance (G) tympanogram, and Panel d shows the corresponding admittance (Y) and admittance phase angle (fy) tympanograms. The pattern designated 1B1G (one susceptance maximum and one conductance maximum) occurs when the absolute value of reactance is larger than resistance for all ear-canal pressures. The resultant admittance tympanogram also shows one maxima and is similar in magnitude to the susceptance tympanogram. The phase-angle tympanogram is V shaped with one minimum. These admittance patterns are recorded in normal adult ears for low-frequency probe tones and in approximately 75% of normal adult ears at 660/678 Hz. This pattern also can be recorded at low probe frequencies in pathological middle ears such as those with otosclerosis.
Figure 3. Four examples (1B1G, 3B1G, 3B3G, and 5B3G) of normal susceptance (B) and conductance (G) tympanometric patterns recorded at 660 Hz, which are predicted by the Vanhuyse et al. ( 1975) model based on the relationship between reactance (X) and resistance (R). The admittance (Y) and phase-angle (fy) tympanograms also are shown for comparison (from Osguthorpe, 1986).
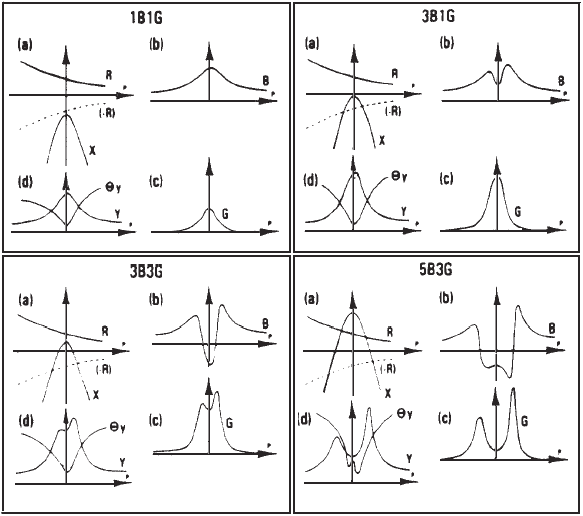
The 3B1G tympanograms occur when the absolute value of reactance is smaller than resistance near the peak and larger than resistance at extreme pressures. This relation between resistance and reactance results in a notched susceptance (B) tympanogram with three extreme and a single-peaked conductance (G) tympanogram. The admittance (Y) tympanograms typically remain single peaked, although a notched admittance (3Y) pattern sometimes is found ( Margolis et al., 1985). The phase-angle tympanogram remains single peaked. This 3B1G pattern is recorded in approximately 20% of normal adults for high-frequency probe tones ( Van Camp, Creten, van de Heyning, Decraemer, & Vanpeperstraete, 1983; Wiley, Oviatt, & Block, 1987; Wilson, Shanks, & Kaplan, 1984). This pattern also is common in eardrum pathologies such as monomeres and tympanosclerotic plaques.
Notching in both the susceptance and conductance (3B3G) tympanograms occurs when reactance (X) is positive (i.e., mass controlled) but smaller than resistance near the peak and greater in absolute value than resistance at extreme pressures. The admittance (Y) tympanogram notches when reactance becomes negative or mass controlled, but the phase-angle tympanogram typically remains single peaked. The 3B3G pattern occurs in only about 8% of normal men at high probe frequencies and in patients with eardrum pathology or ossicular discontinuity.
The 5B3G tympanogram is recorded when reactance is positive and greater than resistance near the peak. The admittance tympanogram is broadly notched, and the phase-angle tympanogram also has a notch. The 5B3G pattern occurs at 660/678 Hz in only about 5% of normal ears and in eardrum pathology and ossicular chain discontinuity.
Van Camp et al. ( 1986) described the conditions that must be met to consider a notched tympanogram normal.
-
Normal notched tympanograms do not occur at low frequencies.
-
The number of extrema must not exceed five for susceptance and three for conductance tympanograms.
-
The pressure difference (in daPa) between the outermost conductance maxima must not exceed the pressure difference between the susceptance maxima.
-
The pressure difference (in daPa) between the outermost maxima must not exceed 75 daPa in 3B3G tympanograms and 100 daPa in 5B3G tympanograms.
In addition to probe frequency, tympanometric shape may vary with changes in other procedural variables. The direction and rate of ear-canal pressure changes and the number of successive tympanometric runs must be specified in reporting tympanometric data. Inattention to procedural variables has contributed to the lack of universally applicable admittance norms.
Direction of ear-canal pressure change. Tympanometric data can be obtained by varying the air pressure in the ear canal in a positive to negative (+ to -) direction or in a negative to positive (- to +) direction. Both tympanometric amplitude and shape are affected by the direction of ear-canal pressure changes ( Beattie & Leamy, 1975; Margolis, Osguthorpe, & Popelka, 1978; Margolis & Smith, 1977; Margolis et al., 1985; Porter & Winston, 1973; Shanks & Wilson, 1986; Van Camp et al., 1986; Williams, 1976; Wilson et al., 1984). Most of these studies indicate that peak compensated static admittance is greater (impedance is lower) for tympanograms recorded in the - to + direction than in the + to - direction of pressure change. Although the direction effect may be statistically significant, the change in tympanometric amplitude does not appear to be clinically significant, particularly for low-frequency probe tones.
Tympanograms obtained in the - to + direction of pressure change also tend to have more complex configurations (i.e., notches), especially at higher probe-tone frequencies (e.g., 678 Hz), than do tympanograms obtained in the + to - direction ( Porter & Winston, 1973; Shanks & Wilson, 1986; Van Camp et al., 1986; Wilson et al., 1984). Wilson et al. ( 1984) and Shanks and Wilson ( 1986) reported that 38–46% of normal adults had notched 678 Hz tympanograms when the - to + pressure direction was used, whereas only 21–25% of the subjects had notched tympanograms when the + to - pressure direction was used.
Rate of ear-canal pressure change. The rate of ear-canal pressure change also can have an effect on tympanometric data. First, because of the nonlinear behavior of the middle ear, the immittance measured in the ear canal may vary with the rate of pressure change. Second, the temporal response of the recording instrument at fast rates of pressure change may produce a measurement artifact disguised as a rate effect on tympanometric measurements. These effects influence the tympanometrically measured middle-ear immittance in opposite ways; the former results in higher admittance, whereas the latter produces lower admittance.
Middle-ear effect. Single-peaked admittance, susceptance, and conductance tympanograms typically increase in amplitude with increasing rates of pressure change ( Creten & Van Camp, 1974; Feldman, Fria, Palfrey, & Dellecker, 1984; Ivarsson, Tjernstrom, Bylander, & Bennrup, 1983; Koebsell & Margolis, 1986; Shanks & Wilson, 1986; Williams, 1976). These authors also reported more complex tympanometric shapes as rate increased. The incidence of notching and the depth of the notch were greater for fast rates of pressure change in comparison with slow rates. These findings are consistent with the following relations.
-
The admittance of the ear increases (impedance decreases) with increasing rates of air-pressure change.
-
Peak susceptance shifts toward negative values (reactance shifts toward positive values) with increasing rates of pressure change.
-
Owing to the shift in the reactance tympanogram, an increase in rate can transform a single-peaked tympanogram into a notched tympanogram.
Instrument effect. As the rate of pressure change increases, the rate of immittance change increases, and thus the recording device is more likely to lag the rapidly changing signal that is being measured. If the temporal response of the recording device is slower than the rate of signal-level change that is being measured, then an increase in rate would reduce the amplitude of tympanometric peaks and artifactually decrease the admittance estimate. The maximum rate of immittance change that can be recorded accurately should be specified by the manufacturer for each instrument.
Most available studies on rate of ear-canal pressure change were performed using commercially available instruments capable of changing pressure at rates of 12–75 daPa/s. New screening instruments, however, are being introduced that can vary pressure at rates up to approximately 600 daPa/s (e.g., Grason-Stadler, Models GSI 27A and 28A; Maico, Model 610; Teledyne, Model TA-7A). These high rates of pressure change have great clinic appeal to those testing infants and children and to those involved in screening programs. Further research will be forthcoming on the effects of these rapid rates of pressure change on immittance measurements.
Successive tympanometric runs. The amplitude and complexity of admittance tympanograms for a constant probe position also increase as the number of successive tympanometric runs increases ( Osguthorpe & Lam, 1981; Vanpeperstraete, Creten, & Van Camp, 1979; Wilson et al., 1984). Changes in conductance and susceptance peak amplitudes of 15%–30% across successive tympanometric recordings have been reported. These studies reported that the greatest change in amplitude occurred during the first three to five tympanometric runs. The incidence of notching also increased with successive tympanometric runs. These findings have been attributed to changes in the viscoelastic properties of the tympanic membrane. Although the clinical implications of this effect probably are insignificant, this methodological variable should be considered in designing research projects and for clinical protocols that involve successive tympanometric runs. This variable also may attain more clinical significance with the introduction of multiple-frequency probe systems that require several tympanometric runs in rapid succession.
Peak Compensated Static Acoustic Immittance
At low probe frequencies at which tympanometric shapes are constant, quantification is needed to distinguish between normal and abnormal ears. The clinical value of quantifying immittance data has been the subject of considerable debate over the past decades. Irrespective of the diagnostic value, the quantification of tympanometric data has several other applications. Quantification assists in transmitting data from one facility to another and in objectively measuring changes over time or changes associated with medical treatment. Quantification also is imperative in research studies in which tympanometric measures must be quantified to evaluate objectively the effects of different methodological factors or disease processes on tympanometric data.
Computational variables such as calculation at peak or ambient pressure, calculation of ear-canal volume, and calculation of peak from notched tympanograms have a large effect on static immittance values. Accordingly, the effects of these methodological variables should be understood and specified in reporting scientific data and in establishing normal static immittance values.
Peak versus ambient pressure. Compensated static immittance has been calculated both at ambient and peak pressures. One of the earliest clinical instruments, the Zwislocki acoustic bridge, was capable of measuring compensated static impedance at a number of probe frequencies but was not capable of varying ear-canal pressure. The original impedance norms, therefore, were obtained at ambient pressure. Currently available immittance instruments are capable of varying ear-canal pressure and, therefore, present the option of calculating static immittance at ambient or at peak pressure. Shanks and Lilly ( 1981) reported that the admittance magnitude at 220 and 660 Hz was 24% lower at ambient than at peak pressure even though the mean ear-canal pressure varied by only 8 daPa (SD = 6 daPa) between these two points on the tympanogram. Similarly, Porter and Winston ( 1973) and Wilson, Shanks, and Velde ( 1981) reported that static admittance at 0 daPa was approximately 33%–16% lower than at peak. This large difference occurs because the slope of the tympanogram is so steep near the peak.
Some authors have argued that immittance measures at ambient pressure are preferred because they represent the resting state of the ear under test or the normal mode of functioning. Immittance at ambient air pressure, however, can fluctuate in a given individual as the person swallows and breathes. Substantial differences in compensated ambient static immittance across time may occur that have no clinical relevance and are merely related to small shifts in middle-ear pressure. As discussed in a subsequent section, shifts in middle-ear pressure are not pathological unless the tympanogram is also reduced in amplitude.
Ear-canal volume estimate. The peak compensated admittance also can vary substantially depending on the ear-canal pressure used to estimate ear-canal volume. Shanks and Lilly ( 1981) reported that compensated peak admittance was 19% higher when volume was estimated at -400 daPa than at 200 daPa. They also reported that static admittance was 9% higher when volume was estimated from the susceptance tympanogram versus the admittance tympanogram. Shanks and Lilly reported that for identical conditions encountered in the plane of the tympanic membrane, a difference in the assumptions made regarding the immittance characteristics of the ear-canal volume produced a difference in the compensated static admittance of 40% at 220 Hz and of 29% at 660 Hz. An accurate and specified volume correction is extremely important in establishing normative compensated static immittance values.
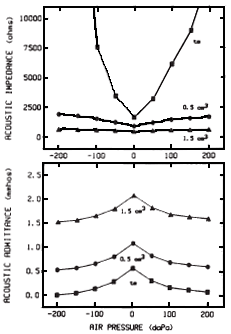
Measurement-plane tympanometry reflects the combined effects of the middle ear and the volume of air enclosed between the probe and the tympanic membrane. Those regularly performing immittance measurements should understand the effect that the ear-canal volume has on individual immittance components measured with any commercially available instrument. The ear-canal volume has a very different effect on tympanometric data depending on whether the data are plotted in impedance or admittance units. These differences are related to the assumption that the impedances of the ear canal and middle-ear systems are configured in parallel rather than in series. A parallel impedance configuration is assumed because the same sound pressure exists at the probe tip and at the surface of the tympanic membrane for probe-tone frequencies less than approximately 1000 Hz ( Djupesland & Zwislocki, 1972; Shaw, 1974; Wiener & Ross, 1946). The parallel configuration also is supported by data showing that the impedance at the probe tip is less than either of the individual elements (i.e., the ear canal or the middle ear). If the two systems were configured in series, then the total impedance would be greater than either individual element. (A detailed discussion of the assumptions underlying the parallel-configuration model is available in Margolis [1981] and Van Camp et al. [1986].)
Figure 4 (adapted from Shanks, 1984) illustrates the effect of two different ear-canal volumes (0.5 and 1.5 cm3) on impedance tympanograms (top panel) and the effect of the same two volumes on admittance tympanograms (bottom panel). Compensated tympanograms (tm) are shown for comparison. The tympanograms in this figure demonstrate the primary advantage of recording tympanograms in admittance rather than in impedance units. As demonstrated in the top panel, ear-canal volume has a nonlinear effect on the shape of tympanograms plotted in impedance units. As the ear-canal volume increases, the shape of impedance tympanograms becomes broader and shallower and is dominated by the ear canal rather than by the structures of interest, the middle-ear transmission system. In contrast, ear-canal volume has a linear effect on the shape of admittance tympanograms. As ear-canal volume increases, the admittance tympanograms in the bottom panel are shifted up by a constant. The shape of the admittance tympanograms remains the same whether the tympanograms are plotted in the plane of the probe or corrected to the plane of the tympanic membrane (i.e., compensated). The morphology of admittance tympanograms, therefore, can be analyzed without correcting for the ear-canal volume. In contrast, impedance tympanograms must be compensated for ear-canal volume prior to an analysis of tympanometric shape.
Figure 4. The effect of ear-canal volume on tympanograms plotted in impedance units (top panel) and admittance units (bottom panel) (adapted from Shanks, 1984).
Another assumption made regarding the ear canal is that the enclosed volume of air can be modeled as pure acoustic compliance (i.e., compliant susceptance or compliant reactance). This condition can be approximated by introducing a high negative or positive pressure into the ear canal to stiffen the eardrum to approximate the condition of a rigid wall or, stated differently, to drive the impedance of the middle-ear system to infinity. If the middle-ear impedance is infinitely high, then the immittance measured in the plane of the probe can be attributed entirely to the ear canal. Figure 5 presents hypothetical tympanograms in which the ear canal functions like an ideal hard-walled cavity when pressurized to -400 daPa and, therefore, can be modeled as pure compliance. At 226 Hz (top panel of Figure 5), a negative pressure of -400 daPa results in a susceptance (B) value of 1.0 acoustic mmho (i.e., a volume estimate of 1 cm3) and conductance (G) of 0 acoustic mmhos. Because of the proportional relation between probe frequency and susceptance, the 678 Hz susceptance (B) tympanogram at -400 daPa (bottom panel of Figure 5) is elevated to 3 acoustic mmhos (i.e., a volume estimate of 1 cm3) and conductance (G) remains at 0 acoustic mmhos. (A discussion of the immittance of an enclosed volume of air can be found in Beranek [1954], Lilly and Shanks [1981], Margolis and Smith [1977], Shanks and Lilly [1981].)
Figure 5. Hypothetical susceptance (B) and conductance (G) tympanograms at 226 Hz (top panel) and 678 Hz (bottom panel) in which the ear canal functions like an ideal hard-walled cavity when pressurized to -400 daPa.
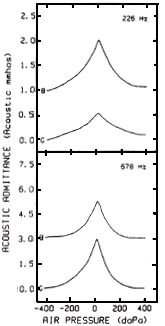
An examination of clinical admittance data, however, shows that this ideal condition is only approximated. First, if the impedance of the middle ear were driven to infinity, then the probe tone would not be audible. Second, the enclosed ear-canal volume does not function acoustically like an ideal hard-walled cavity even at extreme ear-canal pressures as evidenced by minimum conductance values greater than 0 acoustic mmhos, particularly at 678 Hz, and by minimum susceptance values at 678 Hz that are not 3 times larger than susceptance at 226 Hz. Third, experimental data have shown that tympanometric estimates of ear-canal volume overestimate the actual volume; an extreme ear-canal pressure does not drive the impedance of the middle ear to infinity ( Rabinowitz, 1981; Shanks & Lilly, 1981).
Although the assumptions underlying the tympanometric estimates of volume are not precisely met, the procedure is adequate for clinical use. The most serious source of error made in estimating ear-canal volume from tympanograms is the ear-canal pressure used to estimate volume. Despite experimental evidence to the contrary, most clinicians and manufacturers of immittance instruments persist in estimating volume with the ear canal pressurized to +200 daPa. This small positive pressure does not approximate a condition of infinitely high middle-ear impedance. If this assumption is not met, then ear-canal volume will be overestimated, resulting in an underestimation of middle-ear admittance (i.e., erroneously low static admittance). Volume is more accurately estimated from the minimum susceptance value, usually occurring around -400 daPa ( Margolis & Smith, 1977; Shanks & Lilly, 1981). Negative pressures typically produce the highest middle-ear impedance and, therefore, the most accurate volume estimates because the resistance of the middle ear is higher for negative than for positive ear-canal pressures ( Margolis & Smith, 1977; Moller, 1965; Shanks & Lilly, 1981; Vanpeperstraete et al., 1979). This is evidenced by the fact that negative-pressure susceptance values generally are lower than positive-pressure susceptance values ( Wiley et al., 1987). On occasion, however, the opposite is found. The best practice is to choose the minimum (tail) susceptance value to estimate ear-canal volume ( Margolis & Smith, 1977).
With many of the commercially available electroacoustic-admittance instruments, it is possible to record compensated tympanograms by merely zeroing the tympanograms at the starting pressure. Whenever possible, the starting pressure should be set at an extreme negative pressure. If the starting pressure is positive, then compensated tympanograms often will go below zero near the negative tail.
Although the immittance values of interest typically are those compensated for ear-canal volume, an estimate of ear-canal volume itself can be very useful when flat tympanograms are recorded ( Shanks, 1985). If the volume estimate is abnormally small ( < 0.5 cm3 for adults), then impacted cerumen or a seal against the wall of the ear canal should be suspected. If the volume is abnormally large (> 2.5 cm3 for adults or 2.0 cm3 for children), then a perforated tympanic membrane or patent pressure equalization tube is suggested ( Feldman, 1976a, 1976b; Wilber & Feldman, 1976). If the volume is normal (approximately 1–1.5 cm3 in adults), then middle-ear pathologies such as effusion or malleus fixation are suggested. Each clinic should obtain ranges of normal ear-canal volumes appropriate for their clinical population (i.e., children and/or adults) for use in differentiating among flat tympanograms.
Following an estimate of the admittance of the enclosed ear-canal volume, any or all values along the susceptance and/or conductance tympanograms can be compensated or corrected to the plane of the tympanic membrane (tm) using the following equations:
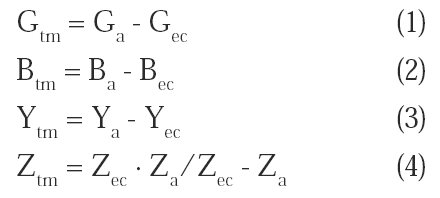
where a denotes measurement plane or probe tip and ec denotes ear canal. Theoretically, Equation 3 (and 4) will be accurate only if conductance (and resistance) is 0, or only if the phase angles for both the middle-ear and ear-canal components are identical. At 226 Hz, both components approach a phase angles of 90° so the error made by adding or subtracting vectors in these two equations, although significant at high frequencies or in pathological ears, is small. At 678 Hz, however, the error may be appreciable, and volume corrections should be made using Equations 1 and 2. The compensated rectangular values (susceptance and conductance) then can be converted to polar form (admittance or impedance magnitude and phase angle) using Equations 5 through 10.
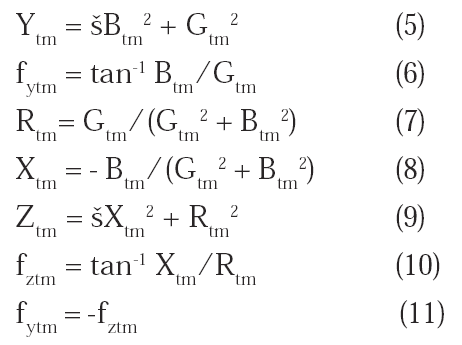
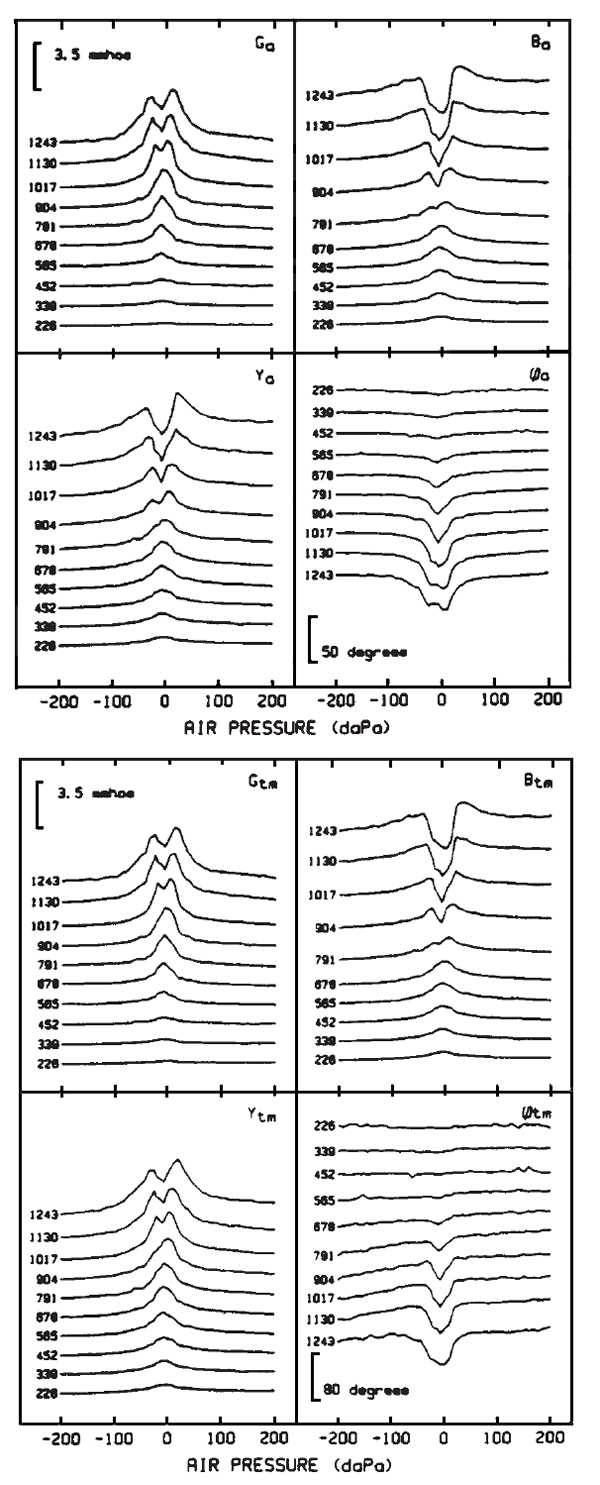
Figure 6 demonstrates the effect of ear-canal volume on the shape of normal, multiple frequency admittance-component tympanograms. To avoid problems associated with the rate and number of earcanal pressure sweeps, Shanks, Wilson, and Palmer ( 1987) fixed the ear-canal pressure and stepped frequency from 226 to 1243 Hz at each of 64 discrete ear-canal pressures. The tympanograms are plotted in rectangular form (conductance [G] and susceptance [B]) and in polar form (admittance magnitude [Y] and phase angle [f]) both in the plane of the probe tip (subscripta) and in the plane of the tympanic membrane (subscript tm). As previously discussed, the shapes of conductance and susceptance tympanograms are unaffected by ear-canal volume. The shapes of the admittance and phase angle tympanograms, however, are altered by the volume of air trapped between the probe tip and the tympanic membrane. The admittance and phase angle tympanograms recorded at the probe tip (left panel) first notched at 904 Hz and 1017 Hz, respectively. In contrast, the compensated admittance tympanograms in the right panel first notched at 1017 Hz, whereas the compensated phase angle tympanograms never notched. An estimate of middle-ear resonance, therefore, will vary depending on whether or not the admittance tympanograms are compensated for ear-canal volume. By definition, middle-ear resonance is estimated most accurately from compensated susceptance or phase angle tympanograms. Following a precise correction for ear-canal volume, the lowest probe frequency (904 Hz in Figure 6) resulting in a peak compensated susceptance value of 0 acoustic ohms or a compensated phase angle of 0° provides an estimate of middle-ear resonance. Resonance cannot be estimated from a simple morphological analysis of the shapes of susceptance and phase angle tympanograms; the data must be carefully quantified. Preliminary data depicted in Figure 6, however, indicate that resonance may be more easily estimated from a morphological analysis of admittance tympanograms rather than from a quantitative analysis of susceptance or phase angle tympanograms. Examination of the uncompensated (Ya) and compensated (Ytm) admittance tympanograms shows that resonance (904 Hz) coincides with the lowest probe frequency producing a notched admittance tympanogram when recorded in the plane of the probe tip. When the admittance tympanograms are corrected for ear-canal volume in the right panel, however, a similar morphological analysis results in an overestimation of middle-ear resonance (i.e., 1017 Hz). Further research will be forthcoming regarding the best plotting format for estimating middle-ear resonance.
Figure 6. Normal multifrequency (226–1243 Hz) conductance (G), susceptance (B), admittance (Y), and phase-angle (f) tympanograms plotted both in the plane of the probe (subscript a) and in the plane of the tympanic membrane (subscript tm) (from Shanks, Wilson, & Palmer, 1987).
Notched tympanograms. Although an analysis of tympanometric shape for high-frequency probe tones seems clinically superior to calculating compensated static immittance, some instances may occur in which it is desirable to quantify the peak amplitude of notched tympanograms. There is confusion over which point on a notched tympanogram represents the peak. The Vanhuyse et al. ( 1975) model depicted in Figure 3 clarifies this point. Peak static admittance is calculated at the air pressure that produces an extremum on the reactance tympanogram. In contrast to single-peaked tympanograms, the largest admittance value on the notched tympanograms does not designate the point of maximum energy. flow. Referring to the Vanhuyse et al. model in Figure 3, the least stiff point (i.e., the minimum reactance value) occurs at the center of the notched susceptance, conductance, and admittance tympanograms. This point, which is designated by the arrows in Figure 3, represents the least stiff point and should be used in calculating peak compensated static admittance.
Peak Compensated Static Immittance Norms
Despite the routine clinical use of immittance measurements over the past few decades, universally applicable immittance norms still have not been established. Inattention to the many procedural and computational variables that must be considered in establishing a range of normal values is partially responsible. Changes in immittance values with age and sex and across instruments further compound the difficulty encountered in establishing normative peak compensated immittance values.
Static immittance has been shown to vary both with the sex and age of the subject group. Small differences in static immittance have been reported between males and females. Females as a group have slightly stiffer ears than males ( Jerger, Jerger, & Mauldin, 1972; Zwislocki & Feldman, 1970), but the difference does not appear large enough to warrant separate norms for males and females. Changes in static immittance with age, however, do appear clinically significant and may require separate norms ( Jerger et al., 1972: Koebsell & Margolis, 1986; Margolis & Popelka, 1975; Porter, 1972).
In addition, it will be necessary to determine whether or not specific norms can be applied to all immittance instruments. Instrument differences can be expected, but the clinical significance of the differences will have to be determined on the new generation of microprocessor-based instruments.
An additional problem arises that must be addressed before normative static immittance values can be defined. Admittance values are positively skewed. Standard deviations and confidence intervals, therefore, cannot be used to define a range of normal values. An alternative has been to perform a logarithmic transformation of the data ( Wilson et al., 1981) or to report the median and 80% or 90% normal range ( Feldman, 1974: Shanks & Wilson, 1986; Wiley et al., 1987: Zwislocki & Feldman, 1970).
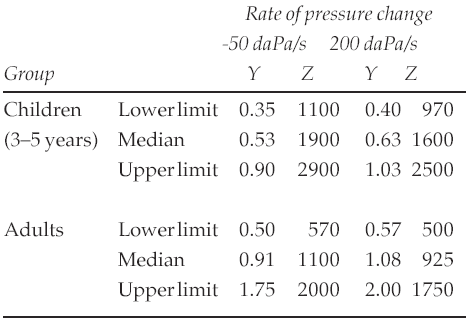
Table 1 illustrates differences measured in 226 Hz peak static admittance values as a function of age and rate of ear-canal pressure change. Ear-canal volume was estimated from the minimum tail value on the tympanograms. The direction of the pressure change is not clinically significant at 226 Hz, but the two component tympanograms must be recorded in the same direction. The values for children were obtained from measurements made at two rates of pressure change (50 and 200 daPa/s) on otologically normal 3–5-year-olds ( Koebsell & Margolis, 1986). The upper and lower limits represent the 90% range. The adult values were obtained from measurements made at only 25 daPa/s. The 200-daPa values for adults were estimated by adjusting the slow pump speed values by proportions calculated from the data obtained on children. The upper and lower limits for adults represent the 90% range of the available data.
Table 1. Normal (90% range) 226 Hz admittance (Y) and impedance (Z) values for two age groups and two rates of ear-canal pressure change (from Koebsell & Margolis, 1986).
Wiley et al. ( 1987) have obtained peak compensated admittance norms from adult subjects (77 women and 50 men) between 20 and 30 years of age. Table 2 shows the 90% normal range of peak compensated static admittance at 226 Hz. Peak static values were calculated from tympanograms recorded using ascending ear-canal pressure changes at a rate of 50 daPa/s. Ear-canal volume was estimated from the conductance, susceptance. and admittance tympanograms at -250 daPa. The 90% ranges at 226 Hz were obtained from 239 ears and the ranges at 678 Hz were obtained from 184 ears with single-peaked tympanograms. These static norms now must be applied to large groups of pathological middle ears to test their clinical utility.
Table 2. Ninety percent normal range for peak compensated static conductance (G), susceptance (B), admittance (Y), and phase angle (f) obtained from 20–30-year-old adults (adapted from Wiley et al., 1987). The values at 226 Hz were obtained from 239 ears of 127 subjects, and the values at 678 Hz were obtained from 184 ears with single-peaked tympanograms.
| G | B | V | f | ||
|---|---|---|---|---|---|
| (mmhos) | (mmhos) | (mmhos) | (degrees) | ||
| 226 Hz | Lower limit | 0.10 | 0.31 | 0.33 | 56 |
| Upper limit | 0.85 | 1.64 | 1.84 | 76 | |
| 678 Hz | Lower limit | 0.60 | 0.87 | 1.06 | 32 |
| Upper limit | 4.95 | 3.92 | 6.31 | 59 |
Tympanometric Width
Evaluation of tympanometric width, often termed tympanometric gradient, may supplement the use of static immittance ( Brooks, 1969; deJonge, 1983, 1986: Feldman et al., 1984: Koebsell & Margolis, 1986: Margolis & Heller, 1987: Paradise et al., 1976; Shanks & Wilson, 1986; Williams, 1976), Although not widely used clinically owing to a lack of normative data, tympanometric width has been shown to be useful in detecting middle-ear effusion ( Brooks, 1968; Fiellau-Nikolajsen, 1983; Haughton, 1977; Paradise et al., 1976) and in ossicular fixation ( Dieroff, 1978; Ivey, 1975; Margolis & Shanks, 1985). As with static immittance measurements, large differences in measurement procedures have precluded the establishment of normative tympanometric width data. DeJonge ( 1986) and Koebsell and Margolis ( 1986) reported that the optimal method of calculating width is the calculation of the pressure interval corresponding to a 50% reduction in compensated peak admittance. Because tympanometric width is determined from compensated peak admittance, the method of ear-canal volume correction influences the values. Table 3 presents normative tympanometric width values for two ear-canal compensation methods. Minimum ear-canal correction refers to estimating the ear-canal contribution from the minimum tail value, and +200 daPa and -300 daPa refer to estimating ear-canal admittance at +200 daPa and -300 daPa, respectively. The normal ranges for tympanometric width in Table 3 are normally distributed, invariant with the rate of pressure change from 50 to 400 daPa/s, and are poorly correlated with (and therefore supplemental to) peak static admittance. In other words, tympanometric width appears to be sensitive to mechanical changes in the middle ear that are not always detected by other tympanometric measures. Future research is needed to confirm the clinical utility of tympanometric width measures.
Table 3. Normative tympanometric width data at 226 Hz from three studies. Tympanometric width is the pressure interval corresponding to a 50% reduction in peak compensated admittance.
| Study | Population | Pressure rate |
Ear-canal correction |
M | 90% range |
|---|---|---|---|---|---|
| deJonge ( 1986) |
Adults | 50 daPa/s | -300 daPa | 110 | 60–160 |
| Koebsell & Margolis ( 1986) |
Children (3–5 yrs) |
50 & 200 daPa/s |
Minimum | 133 | 80–200 |
| Margolis & Heller ( 1987) |
Children (3–5 yrs) |
200 & 400 daPa/s |
+200 daPa | 100 | 59–151 |
| Adults | 200 & 400 daPa/s |
+200 daPa | 77 | 51–114 |
Tympanometric Peak Pressure
The preceding discussion has focused on tympanometric shape and amplitude. Another parameter that has been extracted from tympanograms is the tympanometric peak pressure, which has been used as an indirect measure of the pressure status of the middle ear and a criterion for medical referral. Early tympanometric procedures placed significant emphasis on this value. Recent clinical investigations, however, have shown that tympanometric peak pressure is of limited clinical use because of two basic problems.
First, although tympanometric peak pressure correlates highly with middle-ear pressure, differences can occur between the two values. The error in estimating middle-ear pressure from tympanometric peak pressure is less than 30 daPa in normal ears and is largely because of movement of the tympanic membrane during tympanometry ( Eliachar & Northern, 1974; Flisberg, Ingelstedt, & Ortegren, 1963; Renvall & Holmquist, 1976). The difference between tympanometric peak pressure and middle-ear pressure, however, can be larger in abnormal ears. For example, Renvall and Holmquist ( 1976) found pressure differences in human temporal bones ranging from 0% to 70%. Flisberg et al. ( 1963) attributed the large discrepancy to a decrease in middle-ear volume due to inflammation of the middle-ear tissues that results in a large middle-ear pressure change with movement of the tympanic membrane during tympanometry. The disparity between tympanometric peak pressure and middle-ear pressure also is large in patients with monomeric tympanic membranes who have abnormally large eardrum displacement during tympanometry. Thus, the error in estimating middle-ear pressure from tympanometric peak pressure is largest in patients of greatest clinical interest (i.e., those with middle-ear disease).
The second, more important, problem with tympanometric peak pressure is that it is not a good indicator of middle-ear effusion ( Fiellau-Nikolajsen. 1983; Haughton. 1977). Tympanometric peak pressure has been reported to fluctuate greatly in children who do not develop middle-ear disease ( deJonge & Cummings, 1985: Lildholdt, 1980). Extreme tympanometric peak pressure in conjunction with normal tympanometric amplitude and shape, therefore, is not a good criterion for medical referral. School screening programs that refer children to physicians because of extreme negative pressure have been criticized for high overreferral rates ( Lucker, 1980; Roush & Tait, 1985).
Abnormal Tympanometric Shapes
In the presence of middle-ear disease, the relation between stiffness, mass, and friction elements will change, resulting in a shift in the resonant frequency of the middle-ear transmission system. If the middle ear is stiffened because of a pathology such as otosclerosis, then the ear will remain stiffness-controlled over a wider frequency range than normal, and thus, the resonant frequency of the middle ear will be shifted toward a higher than normal frequency. In contrast, if the ear becomes mass controlled because of a pathology such as ossicular discontinuity, then the resonant frequency of the middle ear will decrease. The subsequent discussion will present examples of abnormal stiffness- and mass-controlled tympanograms plotted in a variety of forms that are being introduced with the new generation of microprocessor-based immittance instruments.
Susceptance and Conductance Tympanograms
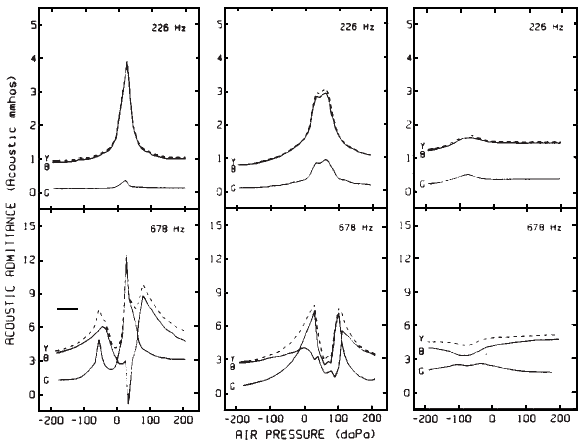
With currently available two-component instruments, changes in middle-ear resonance can be inferred by examining tympanometric shapes at two frequencies, 226 and 678 Hz. If the ear is abnormally mass controlled at 678 Hz, then a mass pathology is suspected. In Figure 7, examples of two-component, two-frequency admittance tympanograms reflecting a mass-controlled system because of ossicular discontinuity (left panel), tympanosclerosis (middle panel), and secretory otitis media (right panel) are shown. The increase in mass is obvious from an examination of tympanometric shapes at 660/678 Hz, but is not easily recognized from tympanometric shapes at 226 Hz. The 678 Hz tympanograms recorded in ossicular discontinuity and tympanosclerosis both can be classified as abnormally mass-controlled according to the Van Camp et al. ( 1986) criteria previously discussed. The tympanograms in the left panel of Figure 7 (ossicular discontinuity) are abnormal because the shapes are too complex (i.e., more than three extrema for the 678 Hz conductance tympanogram) and because the notches are too broad (i.e., the distance between the outermost maxima exceeds 75–100 daPa for both the 678 Hz susceptance and conductance tympanograms). The tympanograms in the right panel of Figure 7 (secretory otitis media) are abnormal because the notch width in the 678 Hz susceptance tympanogram exceeds 75 daPa. The tympanograms in the middle panel (tympanosclerosis) are abnormal because notching occurs at 226 Hz and because the shapes are too complex and broadly notched at 678 Hz. Pathologies of the tympanic membrane such as tympanosclerosis and monomeres often produce abnormal, mass-controlled tympanograms with little if any effect on hearing sensitivity. Low impedance tympanic-membrane pathologies present one of the most frustrating problems associated with tympanometric measures. A low impedance tympanic-membrane pathology will dominate completely the tympanometric pattern and will mask a more clinically important, high-impedance pathology such as otosclerosis. This case points out the importance of an otoscopic examination. The presence of a tympanic membrane pathology seriously restricts the use of tympanometry in the differential diagnosis of a conductive hearing loss because it may mask a coexisting, more medial pathology.
Figure 7. Mass-controlled admittance tympanograms (admittance [Y], susceptance [B], and conductance [G]) at 220/226 Hz and 660/678 Hz due to ossicular discontinuity (left panel from Feldman, 1976), tympanosclerosis (middle panel from Shanks, 1984), and secretory. otitis media (right panel from Margolis & Shanks, 1985).
If the 678 Hz tympanogram reflects abnormal stiffness (i.e., if the admittance vector is close to the 90° axis or greater than approximately 45° in adults), then a stiffness pathology is suspected. In Figure 8, examples of two-component, two-frequency admittance tympanograms with abnormal stiffness due to otosclerosis (left panel), lateral ossicular fixation (middle panel), and middle-ear effusion (right panel) are illustrated. Although the tympanograms in the left panel have a peak, they are classified as abnormally stiff. At 678 Hz, the peak compensated susceptance value is approximately twice as large as the conductance value. This places the admittance vector at approximately 63° (refer to Figure 2), which is abnormally close to the 90° axis. In this case, the ear is abnormally stiff and gives a result similar to that expected in a normal ear at a probe frequency of 226 Hz. As previously stated, a 678 Hz probe tone should produce peak compensated conductance that is larger than or equal to susceptance (i.e., phase angle less than 45°) in men.
Figure 8. Stiffness-dominated admittance (Y), susceptance (B), and conductance (G) tympanograms at 226 and 678 Hz due to otosclerosis (left panel), lateral ossicular chain adhesions (middle panel), and middle-ear effusion (right panel) (taken from Shanks, 1984).
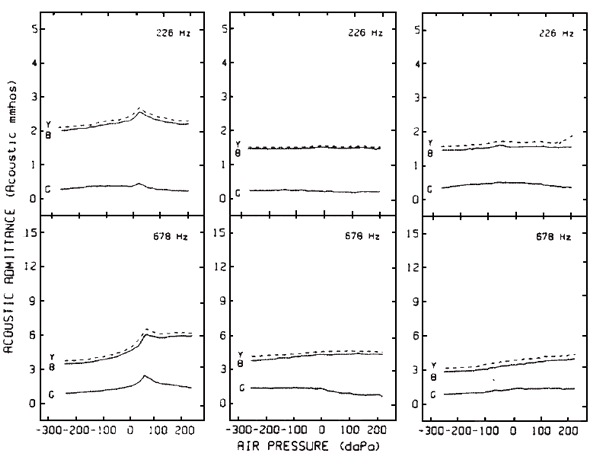
The remaining two tympanograms in Figure 8 are flat. When a tympanogram is flat, an estimate of the volume of air medial to the probe tip should be calculated to rule out the presence of a tympanic-membrane perforation. Volume is most accurately estimated from the 226 Hz susceptance (or admittance if a single-component instrument is used) tympanogram. A volume estimate from the last two tympanograms of approximately 1.5 cm3 indicates an intact tympanic membrane. The tympanograms are essentially identical, but the middle-ear pathologies are different (malleus fixation in the middle panel and middle-ear effusion in the right panel). These two examples reinforce the idea that tympanometry does not indicate the exact disease process causing a conductive hearing loss. Flat tympanograms with similar volume estimates can be recorded in lateral ossicular fixation, middle-ear effusion, an extremely scarred and thickened tympanic membrane, and a perforated tympanic membrane with a cholesteatoma or scar tissue filling the middle-ear space.
Tympanograms always should be interpreted in conjunction with an otoscopic examination and an audiogram. Increases in mass should be reflected in the audiogram with a high-frequency conductive hearing loss, whereas increases in stiffness should have the predominant effect in the low frequencies. Some excellent examples of abnormal two-component, two-frequency tympanograms also are presented by Feldman ( 1976b) and are correlated with a battery of test results by Wilber and Feldman ( 1976).
Magnitude and Phase Angle
An alternative to plotting rectangular-component (susceptance and conductance) tympanograms is to plot the tympanograms in polar form (i.e., admittance magnitude and phase angle). Figure 9 (from Van Camp et al., 1986) illustrates 660 Hz admittance (Y) and phase angle (f) tympanograms recorded in the plane of the probe tip in a normal middle ear (left panel), in a middle ear with ossicular abnormality (middle panel), and in a middle ear with effusion (right panel). The corresponding susceptance (B) and conductance (G) tympanograms are shown for comparison.
Figure 9. Admittance magnitude (Y) and phase-angle (f) tympanograms recorded at 660 Hz from a normal middle ear (left panel), from an ear with ossicular abnormality (middle panel), and from an ear with middle-ear effusion (right panel) (taken from Van Camp et al., 1986). The corresponding susceptance (B) and conductance (G) tympanograms are shown for comparison.
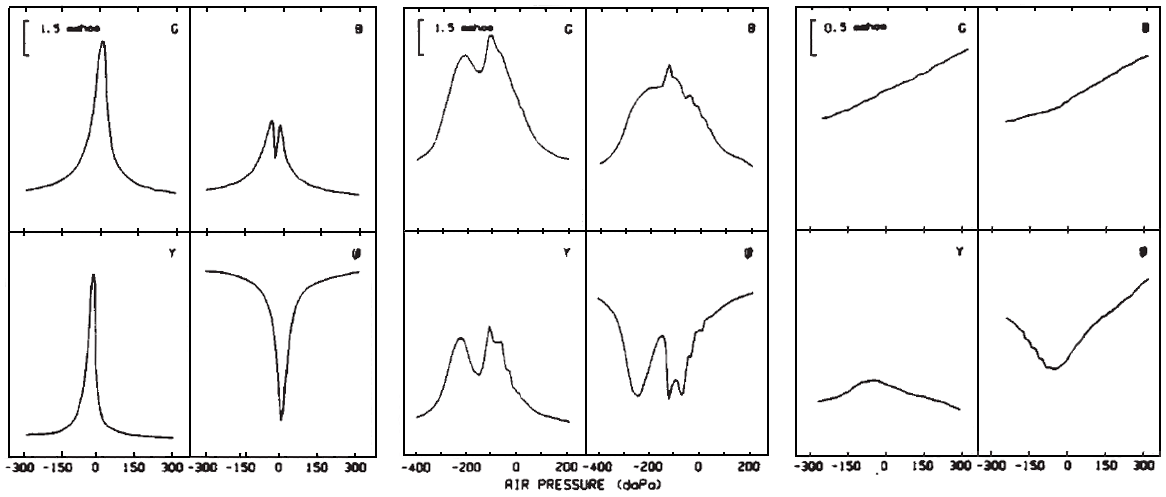
Plotting admittance tympanograms in polar form rather than in rectangular form may prove advantageous and easier to interpret. Van Camp et al. ( 1983) reported that notching occurred in 678 Hz phase-angle tympanograms in the plane of the tympanic membrane (ftm) only in the presence of a mass related, middle-ear pathology. Second, phase-angle tympanograms may be superior to susceptance and conductance tympanograms because phase is calculated from the ratio of susceptance to conductance (see Equation 6). Clinical experience suggests that the relation between the magnitudes of susceptance and conductance is important in differentiating normal and pathological middle ears. Intuitively then, phase angle should reduce the large normal variability observed in susceptance and conductance amplitudes.
Phasor Diagrams
Rather than plotting two tympanograms (susceptance as a function of ear-canal pressure and conductance as a function of ear-canal pressure), Creten, Van Camp, Vanpeperstraete, and Van de Heyning ( 1979) and Creten, Van Camp, Maes, and Vanpeperstraete ( 1981) introduced a different format for presenting all the data in one graph called a phasor diagram. They were searching for a format that would be easy to measure, that would produce a simple yet informative pattern in the normal ear, and that could be easy to interpret for pathological ears. The phasor diagrams taken from Gersdorff Stoquart ( 1985) in Figure 10 plot the interaction between conductance (G on the X-axis) and susceptance (B on the Y-axis) at the probe tip while ear-canal pressure is varied. The top panel (S1) shows an example of a normal 660 Hz phasor plot, and the bottom panel (S2) shows an abnormally stiff middle ear due to otosclerosis. The susceptance and conductance tympanograms are shown for comparison. As previously discussed, the magnitude of conductance (i.e., distance along the X-axis) should be approximately equal to or slightly larger than the magnitude of susceptance (i.e., the distance along the Y-axis) in the normal adult male ear. Simply stated, the phasor plot should be slightly wider than it is high. In the case of otosclerosis, the ear is stiffer as characterized by the larger susceptance than conductance peak magnitude. In this case, the phasor plot is higher than it is wide.
Figure 10. Phasor diagrams at 660 Hz in comparison with the corresponding susceptance (B) and conductance (G) tympanograms recorded from a normal middle ear (SI) and from an ear with otosclerosis (S2) (taken from Gersdorff & Stoquart, 1985).
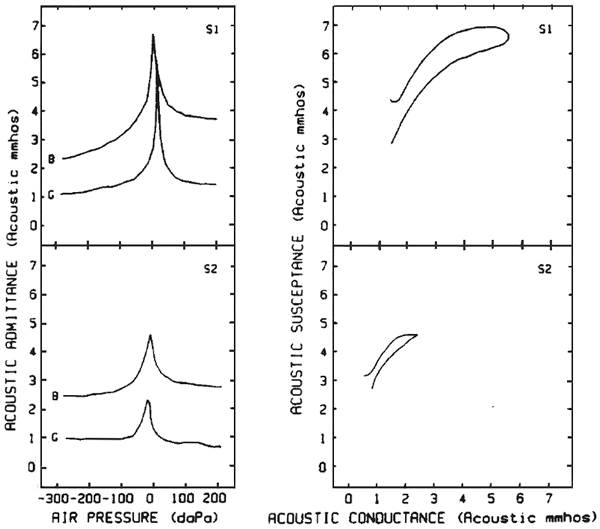
Figure 11 (from Creten et al., 1979) depicts examples of phasor diagrams recorded from a normal, notched 660 Hz susceptance tympanogram (left panel) and an abnormally mass-controlled ear due to ossicular discontinuity (right panel). Susceptance, conductance, and admittance tympanograms are shown for comparison. The phasor diagram associated with ossicular discontinuity is very complex and easily distinguished from the normal examples.
Figure 11. Phasor tympanograms at 660 Hz obtained from simultaneously recorded susceptance (B) and conductance (G) tympanograms for a normal middle ear (left panel) and for an ear with a fracture of the long process of the incus (right panel) (taken from Creten et al., 1979).
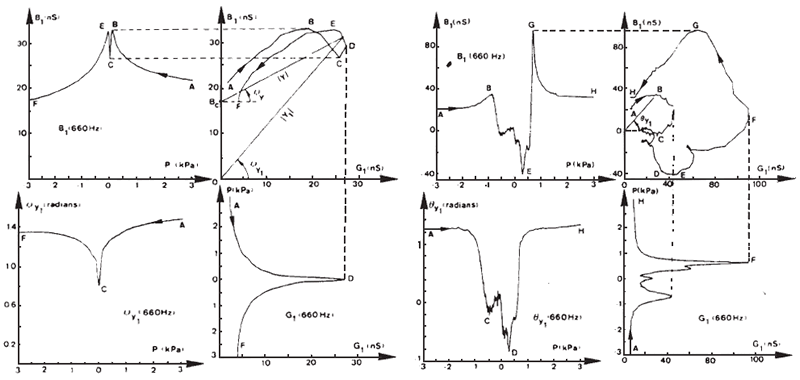
Multiple-Frequency Tympanograms
Rather than inferring changes in the middle-ear resonant frequency from measurements at one or two discrete frequencies, microprocessor-based immittance devices are capable of multiple-frequency tympanometry. (See also Lilly [1984] for a discussion of new measurement techniques.) Colletti ( 1975, 1976, 1977) was one of the first to develop an impedance instrument capable of multiple-frequency tympanometry from 200 to 2000 Hz. Because Colletti plotted the magnitude of the impedance vector, the tympanograms are inverted with respect to the admittance tympanograms in the previous figures. Colletti defined the normal frequency range for the emergence of three different tympanometric patterns. The first pattern shown in the left panel of Figure 12 is recorded at low frequencies ( <1000 Hz) at which the ear is stiffness controlled (i.e., below middle-ear resonance) and is V shaped with one impedance minimum. The second pattern, recorded at mid frequencies (650–1400 Hz, M = 1000 Hz, SD = 170 Hz) near the resonant frequency of the middle ear, is W shaped with two minimum impedance values. The third pattern, recorded at high frequencies above the resonant frequency of the middle ear (>1400 Hz) at which the middle ear is mass controlled, is an inverted V shape with a single impedance maximum.
Figure 12. Three tympanometric shapes recorded using a multiple-frequency probe tone in patients with normal and abnormal middle ears. The frequency intervals at which the tympanometric shapes occur are tabularized for patients with normal middle ears, with ossicular discontinuity, and with otosclerosis (after Colletti, 1977).
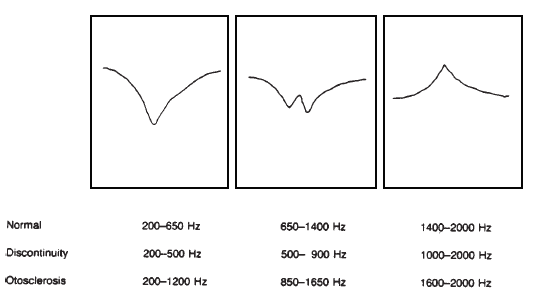
These three tympanometric shapes also are recorded in many middle-ear diseases, but the transition among patterns occurs at different frequencies depending on the disease process. The frequency interval at which the characteristic tympanometric patterns appear is the important feature in the differential diagnosis of middle-ear disease. Colletti found that the frequency at which the W pattern (middle panel of Figure 12) appears is the easiest to identify. The frequency ranges associated with each tympanometric pattern in normal and pathological middle ears are shown in Figure 12. In patients with ossicular discontinuity, the W pattern occurs between 500 and 900 Hz. This finding is related to an increase in the mass of the middle-ear transmission system with a concomitant decrease in the middle-ear resonant frequency. Conversely, in patients with stapes fixation, the W pattern occurs between 850 and 1650 Hz (M = 1300 Hz) with considerable overlap of the normal range. This finding is consistent with an increase in stiffness with a concomitant increase in the middle-ear resonant frequency. Although tympanometric results from patients with both stapedial fixation and ossicular discontinuity overlapped the normal range, very little overlap occurred between these two pathological groups. In the presence of a conductive hearing loss, then, the Colletti procedure should be valuable in differentiating between the two pathologies.
As opposed to plotting the entire family of tympanograms and examining the tympanometric shape, compensated static immittance values can be plotted as a function of probe frequency. Figure 13 (from Lilly, 1973) shows a plot of compensated static resistance and reactance values measured using one of the first available instruments, the Zwislocki acoustic bridge. Although this instrument was capable of making static impedance measurements at multiple frequencies, there was no mean for varying ear-canal pressure. All measurements, therefore, were obtained at atmospheric pressure. Median values for ambient compensated static impedance are plotted as a function of probe frequency for patients with surgically confirmed otosclerosis (O symbols) and ossicular discontinuity (S symbols) in comparison with the 80% normal range (shaded area). Resistance changes more with probe frequency in otosclerosis than in normal middle ears, although the median resistance values fall within the 80% normal range. As expected, reactance is more negative or stiffness controlled in otosclerosis than normal with a concomitant increase in the middle-ear resonant frequency (i.e., the frequency at which reactance equals 0 acoustic ohms). In contrast, ossicular discontinuity results in a decrease in resistance in comparison with normal because the cochlea, or primary source of resistance, is decoupled from the middle-ear system. Median reactance falls below the 80% normal range and becomes positive or mass controlled above 500 Hz, indicating a decrease in the middle-ear resonant frequency.
Figure 13. A plot of compensated static resistance and reactance at atmospheric pressure as a function of probe frequency. The 80% range of normal is shown by the shaded area in comparison with median values for patients with otosclerosis (O) and patients with ossicular discontinuity (S) (taken from Lilly, 1973).
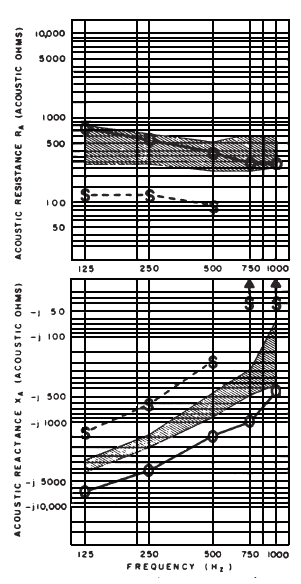
Another format for plotting multiple-frequency tympanograms and static impedance data also will be seen more frequently with the introduction of computer-based immittance devices. In contrast to the static values plotted in rectangular form in Figure 13, the same static values can be plotted in polar form (magnitude and phase angle) as frequency is varied. As shown in Figure 14, Funasaka, Funai, and Kumakawa ( 1984) recorded changes in sound pressure and phase as the probe tone was swept from 220 to 2000 Hz in 4 s at fixed ear-canal pressures of -200 and 0 daPa. The frequency at which the sound-pressure level function crosses zero or at which the phase reaches a maximum provides an estimate of the middle-ear resonant frequency. Figure 14 gives the results obtained on a normal subject (left panel) in which resonance is estimated at approximately 1500 Hz, on a subject with ossicular discontinuity (middle panel) in which the resonant frequency (850 Hz) occurs approximately one octave below normal, and on a subject with otoscelerosis (right panel) in which the resonant frequency occurs at approximately 2250 Hz due to an increase in stiffness.
Figure 14. Changes in sound-pressure level and phase as a function of probe frequency from 220 through 2000 Hz for patients with a normal middle ear (left panel), ossicular discontinuity (middle panel), and otosclerosis (right panel) (from Funasaka et al., 1984).
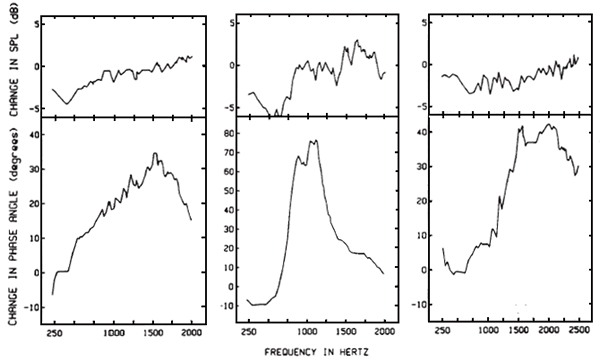
Another plotting format was introduced by Berg ( 1978; reported by Lilly, 1984). Berg displayed a three-dimensional plot of admittance magnitude by frequency as a function of ear-canal pressure. To generate these plots, frequency is swept from 200 to 2000 Hz for constant ear-canal pressures of +300 to -300 daPa, varied in daPa intervals. Figure 15 shows an example of a three-dimensional plot presented by Lilly ( 1984). The family of admittance tympanograms is sliced at different frequencies to show (a) a low-frequency, stiffness-dominated system, (b) a frequency just below resonance, (c) resonant frequency, and (d) a frequency above resonance. As discussed by Colletti, the frequencies at which these admittance patterns occur will vary depending on the disease process.
Figure 15. Three-dimensional plot of a family of normal admittance magnitude tympanograms as a function of frequency. The tympanograms are sliced at different frequencies to show (a) a low frequency at which the ear is stiffness dominated, (b) a frequency just below middle-ear resonance, (c) resonant frequency, and (d) a frequency above resonance (taken from Lilly, 1984).
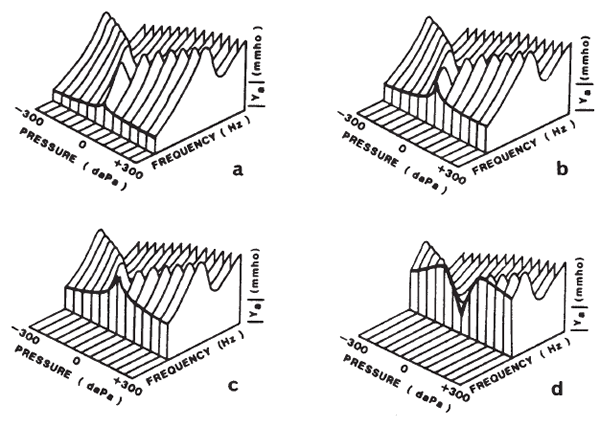
It is important to realize that any of the numerous plotting strategies discussed above are possible with an instrument that measures both components of complex immittance, whether it is in polar or rectangular form. With a computer interface all formats can be plotted in a short time. Future studies must focus on identifying the fastest and easiest method of plotting immittance data and on the range of probe tone frequencies that will optimize the differentiation between normal and pathological middle-ear transmission systems. The multiple-frequency procedures discussed above represent a first attempt at defining an optimal tympanometric procedure and require more extensive data to verify the instrumentation and validity of the high frequency measures.
Summary
Most of the available tympanometric data have been generated with instruments that measure immittance magnitude at 226 Hz. These limited measurements are valuable in evaluating middle-ear pathologies such as effusion and tympanic-membrane perforations but are not always adequate in evaluating pathologies of the ossicular chain such as otosclerosis and ossicular discontinuity. In response to this shortcoming, manufacturers of the newest generation of immittance devices have incorporated variable frequency or click probe signals. With these new instruments, it is possible to evaluate the middle-ear transmission system over its normal range of functioning. These new instruments also are computer based. If two-component, multifrequency immittance measurements are input to the computer, it then becomes possible to analyze and plot the data in many forms.
Currently the technology has outpaced the clinical understanding of these complex measures. The intent of this tutorial was to focus on areas of tympanometry not widely discussed in previous writings. The first two sections on terminology and instrumentation encourage clinicians to know their instruments and to use standardized terminology in communicating data. Much of the remaining information focused on the new generation of multifrequency immittance systems. Examples of normal and pathological tympanograms were plotted at a number of frequencies and in a variety of formats. In the beginning, tympanometric measures will be cumbersome, but as research begins to focus on these new measurements, the best frequency range and frequency interval and the best plotting formats will be identified. In conducting these studies, the procedural (e.g., rate and direction of ear-canal pressure change and the number of successive tympanometric runs) and computational (calculation at peak or 0 daPa and calculation of ear-canal contributions) variables must be specified if the data are to be universally applicable. Once these questions are answered, tympanometric measures with computer-based instruments will be rapid and informative.
Enough data do not yet exist to incorporate multiple-frequency tympanometry into screening programs. Future research will need to address the efficacy of more complex tympanometric screening procedures. It is possible that the 226 Hz screening procedure will prove most efficient in school-aged children, the majority of whom would be identified as having middle-ear effusion by the present procedure, or in the case of ossicular-chain abnormality, would have a significant hearing loss. The complex multiple-frequency measures may prove most valuable in learning more about the normal middle-ear transmission system and in a medical setting. The measurements may be most useful, not in simply detecting a medically referable pathology, but in the differential diagnosis of ear disease and in monitoring the effectiveness of medical treatment regimens and surgical procedures, such as partial and total ossicular-replacement prostheses.
Future tympanometric measures will offer a challenging and exciting new diagnostic tool. It is hoped that this tutorial will help in meeting this challenge and will relieve some of the apprehension associated with using new procedures.
Acknowledgments
The members of the Working Group on Aural Acoustic-Immittance Measurements gratefully acknowledge the support of their respective institutional affiliations toward this tutorial. They are: Veterans Administration Medical Center, Long Beach, and the University of California, Irvine (Shanks and Wilson); Good Samaritan Medical Center, Portland (Lilly); Syracuse University (Margolis): and the University of Wisconsin, Madison (Wiley).
References
American National Standards Institute. (1987). American national standard specifications for instruments to measure aural acoustic impedance and admittance (aural acoustic immittance) (ANSI S3.391). New York: Author.
Beattie, R., & Leamy, D. (1975). Otoadmittance: Normative values, procedural variables, and reliability. Journal of the American Audiology Society, 1, 21–27.
Beranek, L. (1954). Acoustics. New York: McGraw-Hill.
Berg, M. (1978). Modellrechnungen als hilfe zur kausalen deutung van tympanogrammen (Reported by Lilly [1984]). Journal of Audiological Technique, Sonderheft, 45, 52.
Brooks, D. (1968). An objective method of detecting fluid in the middle ear. International Audiology, 7, 280–286.
Brooks, D. (1969). The use of the electro-acoustic impedance bridge in the assessment of middle ear function. Journal of International Audiology, 8, 563–569.
Colletti, V. (1975). Methodologic observations on tympanometry with regard to the probe tone frequency. Acta Otolaryngologica, 80, 54–60.
Colletti, V. (1976). Tympanometry from 200 to 2000 Hz probe tone. Audiology, 15, 106–119.
Colletti, V. (1977). Multifrequency tympanometry. Audiology, 16, 278–287.
Creten, W., & Van Camp, K. (1974). Transient and quasistatic tympanometry. Scandinavian Audiology, 3, 39–42.
Creten, W., Van Camp, K., Maes, M., & Vanpeperstraete, P. (1981). The diagnostic value of phase-angle tympanograms. Audiology, 20, 1–14.
Creten, W., Van Camp, K., Vanpeperstraete, P., & Van de Heyning, P. On phase angle tympanograms and phasor curves. 1979. Paper presented at the Fourth International Symposium on Acoustic Impedance Measurements, Lisbon, Portugal.
DeJonge, R. Normal tympanogram slope. 1983. Paper presented at the American Speech-Language-Hearing Association Annual Convention, Cincinnati, OH.
DeJonge, R. (1986). Normal tympanometric gradient: A comparison of three methods. Audiology, 25, 299–308.
DeJonge, R., & Cummings, D. (1985). Daily fluctuations in middle ear pressure. Asha, 27, 164.
Dieroff, H. (1978). Differential diagnostic value of tympanometry in adhesive processes and otosclerosis. Audiology, 17, 77–86.
Djupesland, G., & Zwislocki, J. (1972). Sound pressure distribution the outer ear. Scandinavian Audiology, 1, 197–203.
Eliachar, I., & Northern, J. (1974). Studies in tympanometry: Validation of the present technique for determining intratympanic pressures through the intact eardrum. Laryngoscope, 84, 247–255.
Feldman, A. (1974). Eardrum abnormality and the measurement of middle ear function. Archives of Otolaryngology, 99, 211–217.
Feldman, A. (1976a). Tympanometry: application and interpretation. Annals of Otology, Rhinology, Laryngology, 85, 202–208.
Feldman, A. (1976b). Tympanometry—Procedures, interpretation and variables. In A. Feldman & L. Wilber (Eds.), Acoustic impedance and admittance—The measurement of middle ear function (pp. 103–155). Baltimore: Williams & Wilkins.
Feldman, A. (1977). Diagnostic application and interpretation of tympanometry and the acoustic reflex. Audiology, 16, 294–306.
Feldman, R., Fria, T., Palfrey, C., & Dellecker, C. (1984). Effects of rate of air pressure change on tympanometry. Ear and Hearing, 5, 91–95.
Fiellau-Nikolajsen, M. (1983). Tympanometry and secretary otitis media. Observations on diagnosis, epidemiology, treatment and prevention in prospective short studies of 3-year-old children. Acta Otolaryngologica (Stockholm), 394, 1–73.
Flisberg, K., Ingelstedt, S., & Ortegren, U. (1963). On middle ear pressure. Acta Otolaryngologica, 182, 43–56.
Funasaka, S., Funai, H., & Kumakawa, K. (1984). Sweep-frequency tympanometry: Its development and diagnostic value. Audiology, 23, 366–379.
Gersdorff, M., & Stoquart, T. (1985). Phasor diagram: A comparative study between normal ears and otosclerotic ears. Audiology, 24, 167–173.
Haughton, P. (1977). Validity of tympanometry for middle ear effusions. Archives of Otolaryngology, 103, 505–513.
Himelfarb, M., Popelka, G., & Shanon, E. (1979). Tympanometry in normal neonates. Journal of Speech and Hearing Research, 22, 179–191.
International Electrotechnical Commission. (1986). Measuring devices, aural impedance/admittance instruments (IEC SC29C; Draft). Geneva, Switzerland: Author.
Ivarsson, A., Tjernstrom, O., Bylander, A., & Bennrup, S. (1983). High speed tympanometry and ipsilateral middle ear reflex measurements using a computerized impedance meter. Scandinavian Audiology, 12, 157–163.
Ivey, R. (1975). Tympanometric curves and otosclerosis. Journal of Speech and Hearing Research, 18, 554–558.
Jerger, J. (1970). Clinical experience with impedance audiometry. Archives of Otolaryngology, 92, 311–324.
Jerger, J., Jerger, S., & Mauldin, L. (1972). Studies in impedance audiometry: I. Normal and sensorineural ears. Archives of Otolaryngology, 96, 523–531.
Koebsell, K., & Margolis, R. (1986). Tympanometric gradient measured from normal preschool children. Audiology, 25, 149–157.
Liden, G. (1969). The scope and application of current audiometric tests. Journal of Laryngology and Otology, 83, 507–520.
Liden, G., Harford, E., & Hallen, O. (1974). Tympanometry for the diagnosis of ossicular disruption. Archives of Otolaryngology, 99, 23–29.
Liden, G., Peterson, J., & Bjorkman, G. (1970). Tympanometry. Archives of Otolaryngology, 92, 248–257.
Lildholdt, T. (1980). Negative middle ear pressure. Variations by season and sex. Annals of Otology, Rhinology, Laryngology, 89, 67–70.
Lilly, D. (1973). Measurement of acoustic impedance at the tympanic membrane. In J. Jerger (Ed.), Modern developments in audiology (pp. 345–406). New York: Academic Press.
Lilly, D. (1984). Multiple frequency, multiple component tympanometry: New approaches to an old diagnostic problem. Ear and Hearing, 5, 300–308.
Lilly, D., & Shanks, J. (1981). Acoustic immittance of an enclosed volume of air. In G. Popelka (Ed.), Hearing assessment with the acoustic reflex (pp. 145–160). New York: Grune & Stratton.
Lucker, J. (1980). Application of pass-fail criteria to middle ear screening results. Asha, 22, 839–840.
Margolis, R. (1981). Fundamentals of acoustic immittance. In G. Popelka (Ed.), Hearing assessment with the acoustic reflex (pp. 117–143). New York: Grune & Stratton.
Margolis, R., & Heller, J. (1987). Screening tympanometry: Criteria for medical referral. Audiology, 26, 197–208.
Margolis, R., Osguthorpe, J., & Popelka, G. (1978). The effects of experimentally produced middle ear lesions on tympanometry in cats. Acta Otolaryngologica, 86, 428–436.
Margolis, R., & Popelka, G. (1975). Static and dynamic acoustic impedance measurements in infant ears. Journal of Speech and Hearing Research, 18, 435–443.
Margolis, R., & Shanks, J. (1985). Tympanometry. In J. Katz (Ed.), Handbook of clinical audiology (pp. 438–475). Baltimore: Williams & Wilkins.
Margolls, R., & Smith, P. (1977). Tympanometric asymmetry. Journal of Speech and Hearing Research, 20, 437–446.
Margolis, R., Van Camp, K., Wilson, R., & Creten, W. (1985). Multifrequency tympanometry in normal ears. Audiology, 24, 44–53.
Moller, A. (1965). An experimental study of the acoustic impedance of the middle ear and its transmission properties. Acta Otolaryngologica, 60, 129–149.
Osguthorpe, J. (1986). Effects of tympanic membrane scars on tympanometry: A study in cats. Laryngoscope, 96, 1366–1377.
Osguthorpe, J., & Lam, C. (1981). Methodologic aspects of tympanometry in cats. Otolaryngology-Head and Neck Surgery, 89, 1037–1040.
Paradise, J., Smith, C., & Bluestone, C. (1976). Tympanometric detection of middle ear effusion in infants and young children. Pediatrics, 58, 198–210.
Popelka, G. (1984). Acoustic immittance measures: Terminology and instrumentation. Ear and Hearing, 5, 262–267.
Porter, T. (1972). Normal otoadmittance values for three populations. Journal of Auditory Research, 12, 53–58.
Porter, T., & Winston, M. (1973). Methodological aspects of admittance measurements of the middle ear. Journal of Auditory Research, 13, 172–177.
Rabinowitz, W. (1981). Measurement of the acoustic input immittance of the human ear. Journal of the Acoustical Society of America, 70, 1025–1035.
Renvall, U., & Holmquist, J. (1976). Tympanometry revealing middle ear pathology. Annals of Otology, Rhinology, Laryngology, 85(Suppl. 25), 209–215.
Renvall, U., Liden, G., Jungert, S., & Nilsson, E. (1975). Impedance audiometry in the detection of secretory otitis media. Scandinavian Audiology, 4, 119–124.
Roush, J., & Tait, C. (1985). Pure-tone and acoustic immittance screening of preschool-age children: An examination of referral criteria. Ear and Hearing, 6, 245–250.
Shanks, J.E. (1984). Tympanometry. Ear and Hearing, 5, 268–280.
Shanks, J. Tympanometric volume estimates in patients with intact and perforated eardrums. 1985. A paper presented at the American Speech-Language-Hearing Association Annual Convention, Washington, DC.
Shanks, J. (1987). Aural acoustic immittance standards. Seminars in Hearing, 8, 307–318.
Shanks, J., & Lilly, D. (1981). An evaluation of tympanometric estimates of ear canal volume. Journal of Speech and Hearing Research, 24, 557–566.
Shanks, J., & Wilson, R. (1986). Effects of direction and rate of ear-canal pressure changes on tympanometric measures. Journal of Speech and Hearing Research, 29, 11–19.
Shanks, J., Wilson, R., & Palmer, C. Multifrequency tympanometry. 1987. A paper presented at the American Speech-Language-Hearing Association Annual Convention, New Orleans.
Shaw, E. (1974). Transformation of sound pressure level from the free field to the eardrum in the horizontal plane. Journal of the Acoustical Society of America, 56, 1848–1861.
Sprague, B., Wiley, T., & Goldstein, R. (1985). Tympanometric and acoustic-reflex studies in neonates. Journal of Speech and Hearing Research, 28, 265–272.
Van Camp, K., & Creten, W. (1976). Principles of acoustic impedance and admittance. In A. Feldman & L. Wilber (Eds.), Acoustic impedance and admittance—The measurement of middle ear function (pp. 300–334). Baltimore: Williams & Wilkins.
Van Camp, K., Creten, W., Van de Heyning, P., Decraemer, W., & Vanpeperstraete, P. (1983). A search for the most suitable immittance components and probe-tone frequency in tympanometry. Scandinavian Audiology, 12, 27–34.
Van Camp, K., Margolis, R., Wilson, R., Creten, W., & Shanks, J. (1986). Principles of tympanometry. ASHA Monographs, 24.
Vanhuyse, V., Creten, W., & Van Camp, K. (1975). On the W-notching of tympanograms. Scandinavian Audiology, 4, 45–50.
Vanpeperstraete, P., Creten, W., & Van Camp, K. (1979). On the asymmetry of susceptance tympanograms. Scandinavian Audiology, 8, 173–179.
Wiener, F., & Ross, D. (1946). The pressure distribution in the auditory canal in a progressive sound field. Journal of the Acoustical Society of America, 18, 401–408.
Wilber, L., & Feldman, A. (1976). The middle ear measurement battery. In A. Feldman & L. Wilber (Eds.), Acoustic impedance and admittance—The measurement of middle ear function (pp. 345–377). Baltimore: Williams & Wilkins.
Wiley, T., & Block, M. (1979). Static acoustic-immittance measurements. Journal of Speech and Hearing Research, 22, 677–696.
Wiley, T., & Block, M. (1985). Overview and basic principles of acoustic-immittance measurements. In J. Katz (Ed.), Handbook of clinical audiology (pp. 423–437). Baltimore: Williams & Wilkins.
Wiley, T., Oviatt, D., & Block, M. (1987). Acoustic-immittance measures in normal ears. Journal of Speech and Hearing Research, 30, 161–170.
Williams, P. Effects of rate and direction of air pressure change on tympanometry. 1976. Unpublished doctoral dissertation, University. of Washington, Seattle.
Wilson, R., Shanks, J., & Kaplan, S. (1984). Tympanometric changes at 226 Hz and 678 Hz across ten trials and for two directions of ear canal pressure change. Journal of Speech and Hearing Research, 27, 257–266.
Wilson, R., Shanks, J., & Velde, T. (1981). Aural acoustic-immittance measurements: Interaural differences. Journal of Speech and Hearing Research, 46, 413–421.
Zwislocki, J., & Feldman, A. (1970). Acoustic impedance of pathological ears. ASHA Monographs, 15.
Figures and Tables
Figure 1. Multiple frequency (220–910 Hz) susceptance (B), conductance (G), and admittance (Y) tympanograms recorded for descending (+/-) ear-canal pressure changes (from Margolis et al., 1985).

Figure 2. Vector diagrams showing normal peak compensated static admittance at 220, 610, 710, and 810 Hz plotted both in polar (admittance [Y] and phase-angle [f]) and rectangular (susceptance [B] and conductance [G]) forms.

Figure 3. Four examples (1B1G, 3B1G, 3B3G, and 5B3G) of normal susceptance (B) and conductance (G) tympanometric patterns recorded at 660 Hz, which are predicted by the Vanhuyse et al. ( 1975) model based on the relationship between reactance (X) and resistance (R). The admittance (Y) and phase-angle (fy) tympanograms also are shown for comparison (from Osguthorpe, 1986).

Figure 4. The effect of ear-canal volume on tympanograms plotted in impedance units (top panel) and admittance units (bottom panel) (adapted from Shanks, 1984).

Figure 5. Hypothetical susceptance (B) and conductance (G) tympanograms at 226 Hz (top panel) and 678 Hz (bottom panel) in which the ear canal functions like an ideal hard-walled cavity when pressurized to -400 daPa.

Figure 6. Normal multifrequency (226–1243 Hz) conductance (G), susceptance (B), admittance (Y), and phase-angle (f) tympanograms plotted both in the plane of the probe (subscript a) and in the plane of the tympanic membrane (subscript tm) (from Shanks, Wilson, & Palmer, 1987).

Figure 7. Mass-controlled admittance tympanograms (admittance [Y], susceptance [B], and conductance [G]) at 220/226 Hz and 660/678 Hz due to ossicular discontinuity (left panel from Feldman, 1976), tympanosclerosis (middle panel from Shanks, 1984), and secretory. otitis media (right panel from Margolis & Shanks, 1985).

Figure 8. Stiffness-dominated admittance (Y), susceptance (B), and conductance (G) tympanograms at 226 and 678 Hz due to otosclerosis (left panel), lateral ossicular chain adhesions (middle panel), and middle-ear effusion (right panel) (taken from Shanks, 1984).

Figure 9. Admittance magnitude (Y) and phase-angle (f) tympanograms recorded at 660 Hz from a normal middle ear (left panel), from an ear with ossicular abnormality (middle panel), and from an ear with middle-ear effusion (right panel) (taken from Van Camp et al., 1986). The corresponding susceptance (B) and conductance (G) tympanograms are shown for comparison.

Figure 10. Phasor diagrams at 660 Hz in comparison with the corresponding susceptance (B) and conductance (G) tympanograms recorded from a normal middle ear (SI) and from an ear with otosclerosis (S2) (taken from Gersdorff & Stoquart, 1985).

Figure 11. Phasor tympanograms at 660 Hz obtained from simultaneously recorded susceptance (B) and conductance (G) tympanograms for a normal middle ear (left panel) and for an ear with a fracture of the long process of the incus (right panel) (taken from Creten et al., 1979).

Figure 12. Three tympanometric shapes recorded using a multiple-frequency probe tone in patients with normal and abnormal middle ears. The frequency intervals at which the tympanometric shapes occur are tabularized for patients with normal middle ears, with ossicular discontinuity, and with otosclerosis (after Colletti, 1977).

Figure 13. A plot of compensated static resistance and reactance at atmospheric pressure as a function of probe frequency. The 80% range of normal is shown by the shaded area in comparison with median values for patients with otosclerosis (O) and patients with ossicular discontinuity (S) (taken from Lilly, 1973).

Figure 14. Changes in sound-pressure level and phase as a function of probe frequency from 220 through 2000 Hz for patients with a normal middle ear (left panel), ossicular discontinuity (middle panel), and otosclerosis (right panel) (from Funasaka et al., 1984).

Figure 15. Three-dimensional plot of a family of normal admittance magnitude tympanograms as a function of frequency. The tympanograms are sliced at different frequencies to show (a) a low frequency at which the ear is stiffness dominated, (b) a frequency just below middle-ear resonance, (c) resonant frequency, and (d) a frequency above resonance (taken from Lilly, 1984).

Table 1. Normal (90% range) 226 Hz admittance (Y) and impedance (Z) values for two age groups and two rates of ear-canal pressure change (from Koebsell & Margolis, 1986).

Table 2. Ninety percent normal range for peak compensated static conductance (G), susceptance (B), admittance (Y), and phase angle (f) obtained from 20–30-year-old adults (adapted from Wiley et al., 1987). The values at 226 Hz were obtained from 239 ears of 127 subjects, and the values at 678 Hz were obtained from 184 ears with single-peaked tympanograms.
| G | B | V | f | ||
|---|---|---|---|---|---|
| (mmhos) | (mmhos) | (mmhos) | (degrees) | ||
| 226 Hz | Lower limit | 0.10 | 0.31 | 0.33 | 56 |
| Upper limit | 0.85 | 1.64 | 1.84 | 76 | |
| 678 Hz | Lower limit | 0.60 | 0.87 | 1.06 | 32 |
| Upper limit | 4.95 | 3.92 | 6.31 | 59 |
Table 3. Normative tympanometric width data at 226 Hz from three studies. Tympanometric width is the pressure interval corresponding to a 50% reduction in peak compensated admittance.
| Study | Population | Pressure rate |
Ear-canal correction |
M | 90% range |
|---|---|---|---|---|---|
| deJonge ( 1986) |
Adults | 50 daPa/s | -300 daPa | 110 | 60–160 |
| Koebsell & Margolis ( 1986) |
Children (3–5 yrs) |
50 & 200 daPa/s |
Minimum | 133 | 80–200 |
| Margolis & Heller ( 1987) |
Children (3–5 yrs) |
200 & 400 daPa/s |
+200 daPa | 100 | 59–151 |
| Adults | 200 & 400 daPa/s |
+200 daPa | 77 | 51–114 |
Notes
[1] Throughout this paper, the use of immittance, admittance, impedance, or the components of immittance implies aural acoustic immittance, aural acoustic admittance (acoustic mmhos = m3/108 Pa's), or aural acoustic impedance (acoustic ohm = 105 Pa's/m3).
Index terms: acoustic impedance audiometry, instrumental assessment
Reference this material as: American Speech-Language-Hearing Association. (1988). Tympanometry [Relevant Paper]. Available from www.asha.org/policy.
© Copyright 1988 American Speech-Language-Hearing Association. All rights reserved.
Disclaimer: The American Speech-Language-Hearing Association disclaims any liability to any party for the accuracy, completeness, or availability of these documents, or for any damages arising out of the use of the documents and any information they contain.
doi:10.1044/policy.RP1988-00027


